
Table of Contents
Detailed Business Plan Calculator Walkthrough
The business plan calculator is the financial modeling workspace inside the business plan editor (/edit-businessplan/:id). It combines source assumptions, recalculation controls, calculated tables, pivot views, and summary outputs in one accordion-based editor.
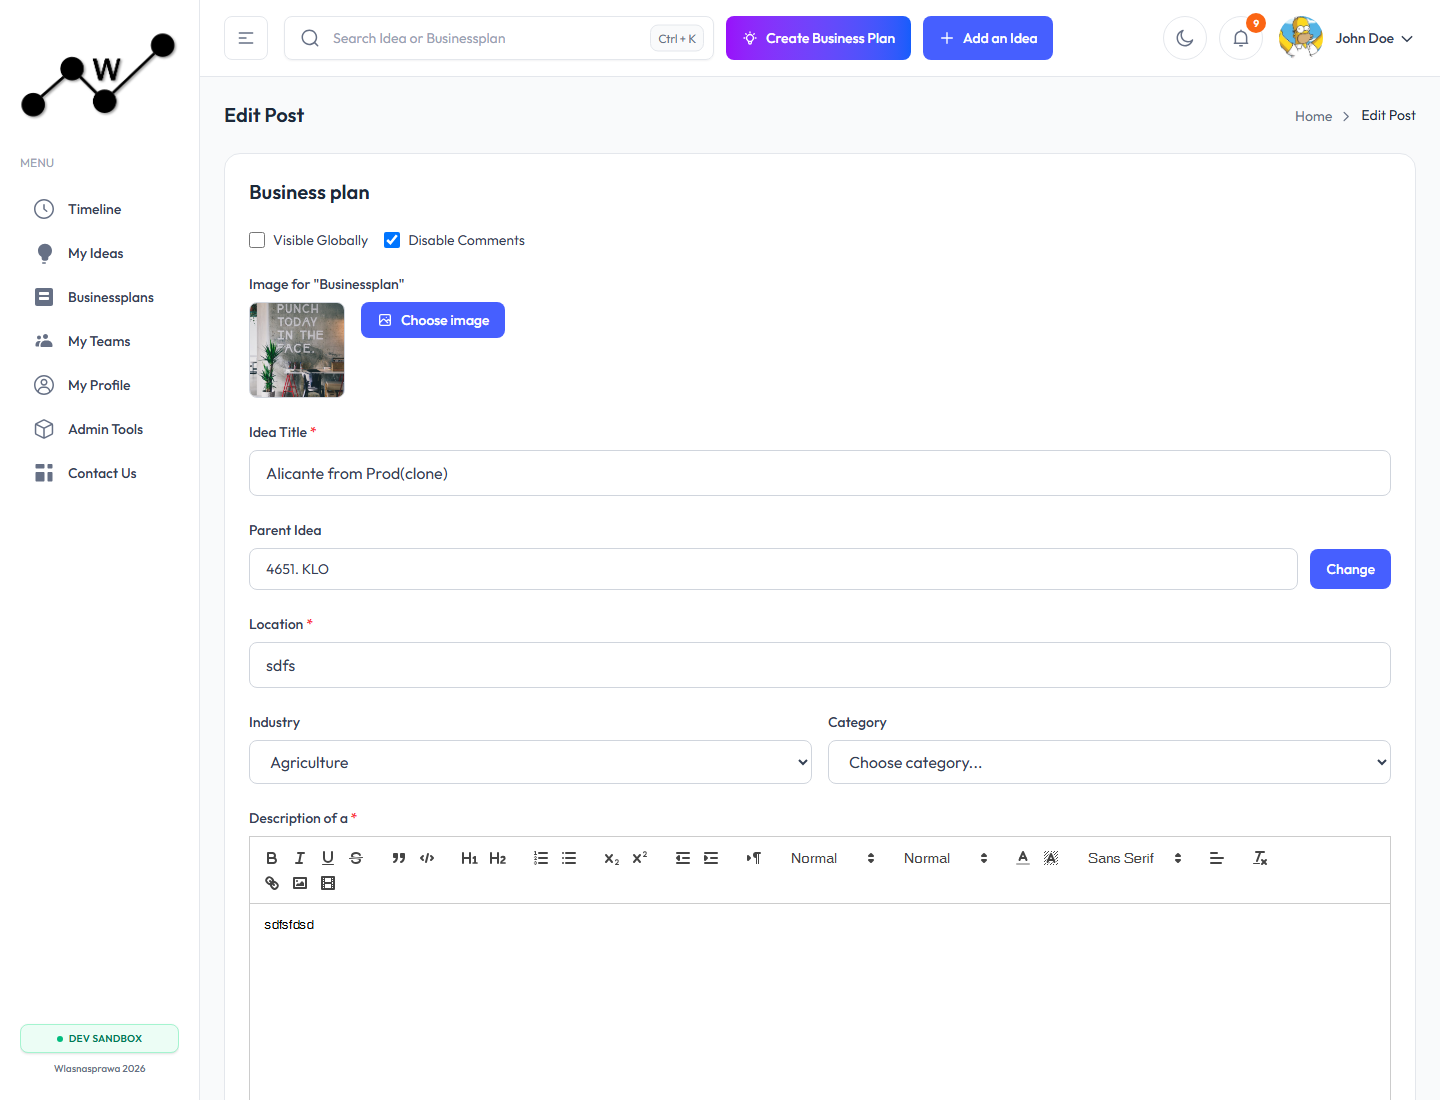
Editor Layout
The page has two layers:
- Business-plan post metadata: title, parent idea, location, industry, category, description, visibility, comments, and image.
- Business-plan calculator: accordion sections for assumptions, calculations, pivots, and final outputs.
The calculator header includes:
- Show code: opens the full business plan JSON viewer.
- Unsaved indicator: appears when local draft changes exist.
- Discard draft: removes the local browser draft.
- Expand all / collapse all: opens or closes all calculator sections.
Most sections also include:
- Status dot: shows whether the section is dirty or recalculated.
- Edit button: switches editable sections into edit mode.
- JSON button: opens the section JSON viewer.
- Apply button: saves section changes into the plan and triggers recalculation.
Collapsed Section Overview
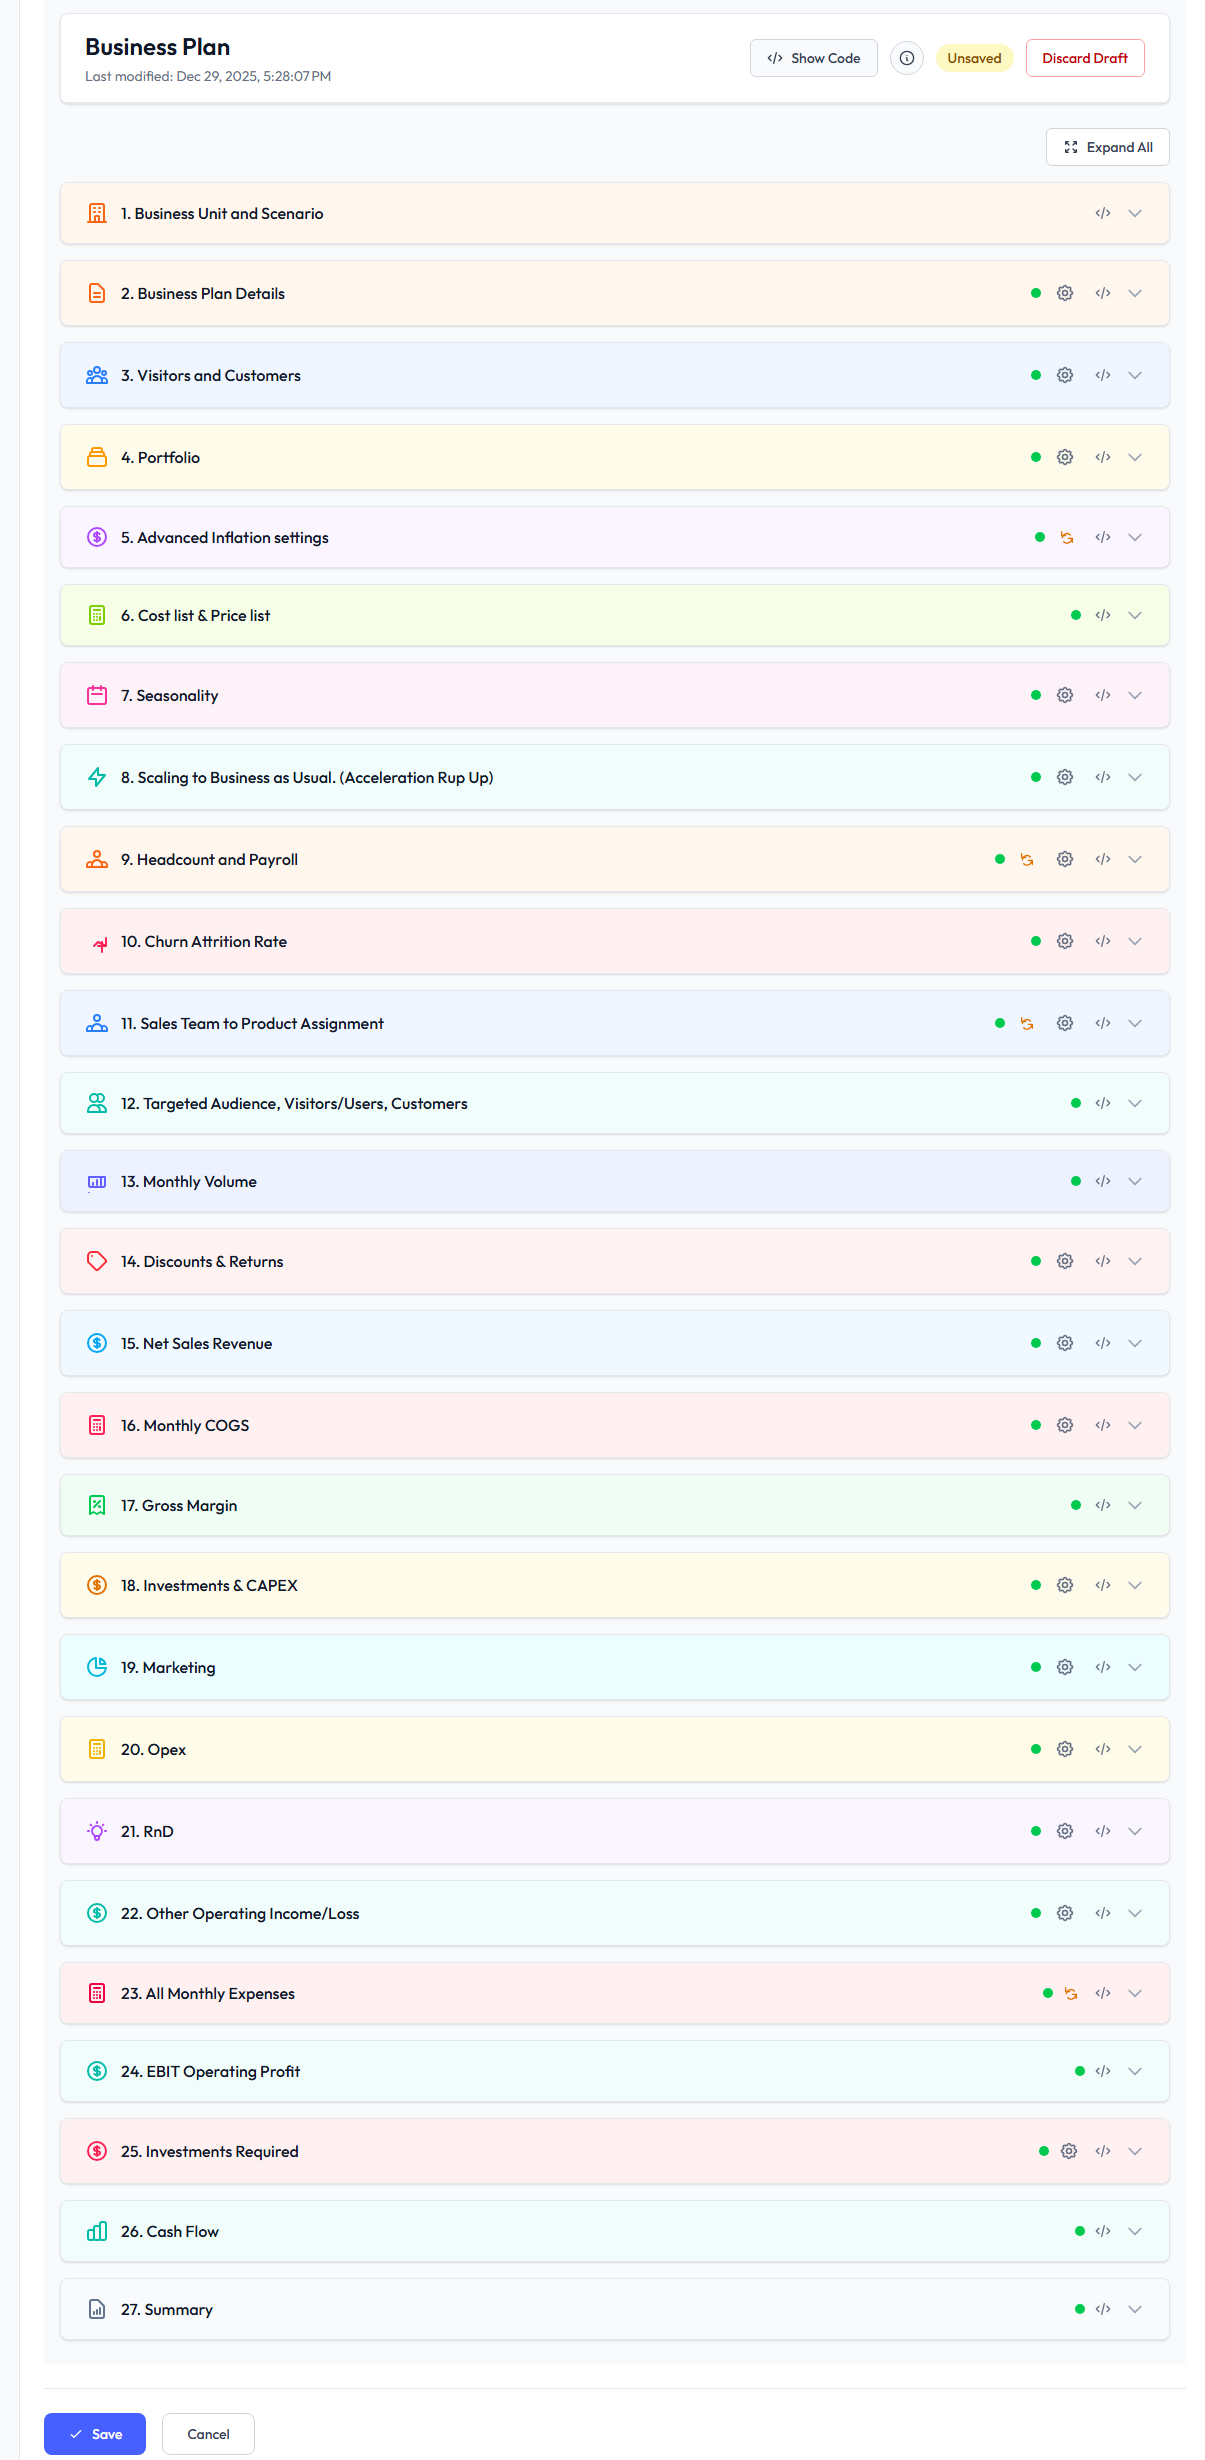
The collapsed view is the calculator map. It shows all 27 sections in the order they are normally reviewed, from high-level assumptions to final outputs.
- The section number shows the recommended reading and calculation flow.
- Colored rows group related planning areas visually, such as demand, sales, costs, expenses, profit, funding, and cash flow.
- The green status dot indicates a section is calculated or currently clean.
- The settings/edit icon appears on sections with editable source assumptions.
- The JSON/code icon opens the section data for inspection.
- The expand arrow opens the section details without losing the overall plan structure.
- Expand All is useful for review sessions; keeping sections collapsed is better when navigating quickly between inputs and outputs.
Apply and Recalculate Flow
Editable sections follow the same pattern:
- Open the section.
- Click the edit/settings button when the section is read-only.
- Change assumptions.
- Click Apply.
- The parent calculator marks the section dirty.
- The calculation service recalculates the section and downstream dependencies.
- The updated source plan is emitted to the editor.
- The editor saves a browser draft.
Calculated sections usually do not ask for direct input. They display derived outputs as cards, tables, charts, pivots, or export-ready rows.
Calculation Dependency Model
The calculator is dependency-aware. A change near the top of the plan can update many downstream sections.
- Plan Details defines the timeline, currency, and period structure used everywhere.
- Visitors and Customers plus Portfolio drive demand and product assumptions.
- Portfolio feeds prices, costs, volume, seasonality, investments, and sales assignment.
- Cost Price, List Price, Volume, Discounts, and Returns feed Net Sales.
- Net Sales, COGS, Expenses, Payroll, and Investments feed Gross Margin and EBIT.
- EBIT, Investments, and funding assumptions feed Investments Required and Cash Flow.
- Summary consolidates the final calculated picture.
Section Reference
1. Business Unit and Scenario
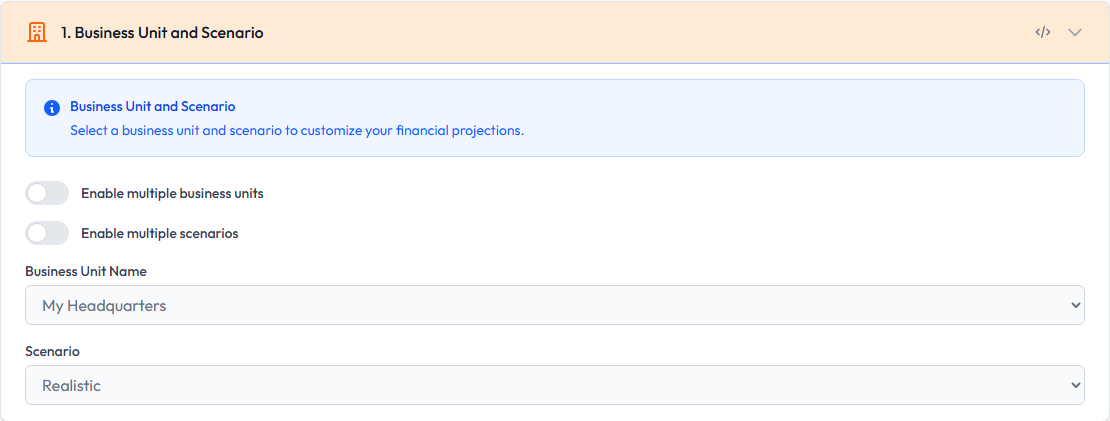
This section is scenario-level context for the model. It is mostly a planning placeholder today, with controls prepared for multi-unit and multi-scenario modeling.
Fields and controls:
- Enable Multiple Business Units: reserved for modeling several locations, branches, or business units in one plan.
- Enable Multiple Scenarios: reserved for optimistic, realistic, and pessimistic scenario comparison.
- Business Unit Name: identifies the business unit being modeled.
- Scenario: names the planning case, such as realistic, optimistic, or pessimistic.
Functionality:
- The current calculator uses one active business unit and one active scenario.
- The section helps readers understand the intended scope of the financial plan.
- The JSON action shows the section source data, even when the visible controls are read-only.
2. Business Plan Details
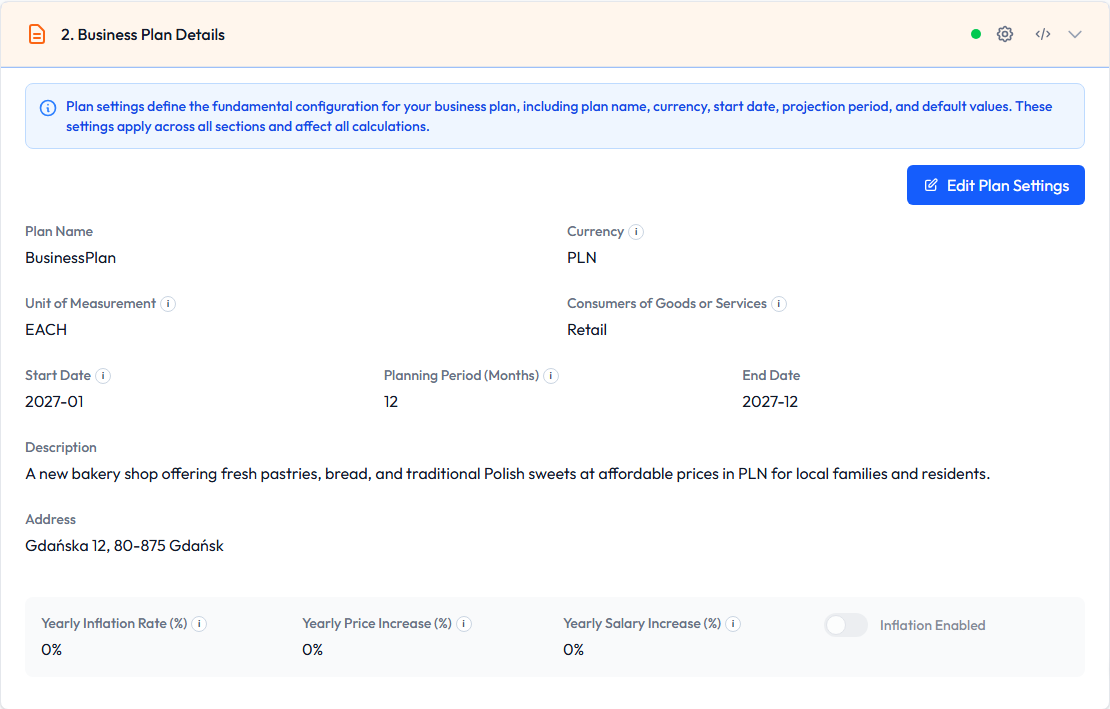
Plan Details is the control center for the whole calculator. These fields define the timeline, currency, measurement basis, and inflation settings used by every downstream section.
Fields and controls:
- Plan Name: internal plan name shown in the calculator and JSON.
- Currency: currency used for amounts, tables, KPIs, exports, and analytics.
- Unit of Measurement: baseline unit for products or services, for example
EACH. - Consumers of Goods or Services: the target consumer or customer group used as business context.
- Start Date: first modeled month.
- Planning Period (Months): number of monthly periods in the plan.
- End Date: calculated from start date and planning period.
- Description: business description carried into plan settings and reports.
- Address: business or market location.
- Yearly Inflation Rate: annual inflation assumption for inflation-aware calculations.
- Yearly Price Increase: annual price growth assumption for list prices.
- Yearly Salary Increase: annual salary growth assumption for payroll.
- Inflation Enabled: turns inflation-aware projections on or off.
Functionality:
- Changing the start date or planning period reshapes every monthly table.
- Inflation settings feed Advanced Inflation, Cost Price, List Price, Payroll, and other projected values.
- Free accounts can save up to 12 monthly periods; Pro accounts can use longer horizons.
3. Visitors and Customers
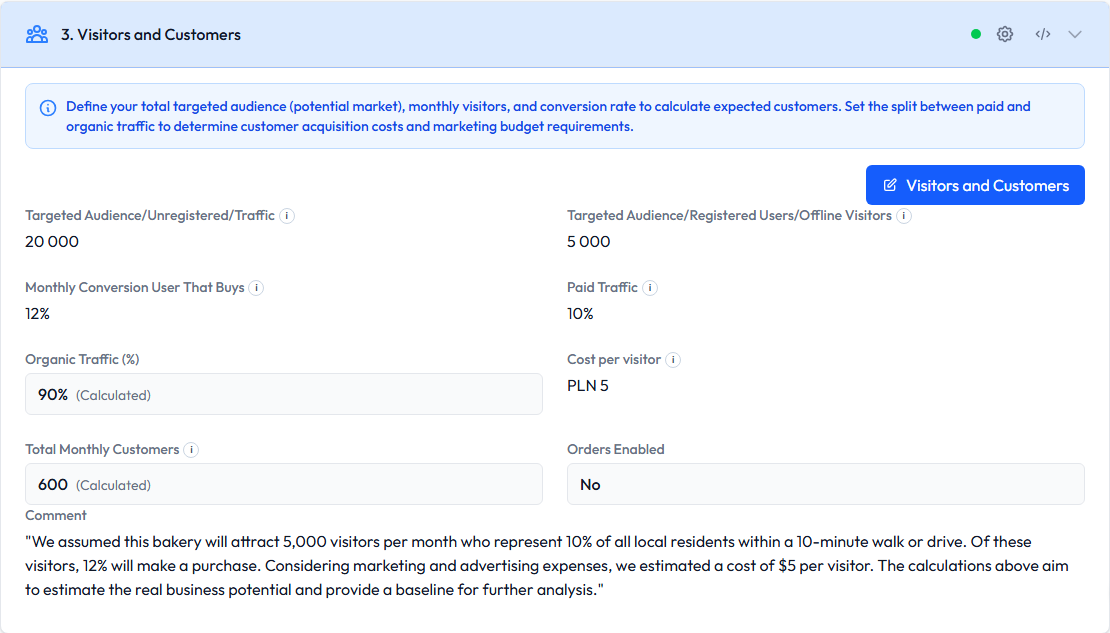
Visitors and Customers captures top-of-funnel demand assumptions. It answers how many people can be reached, how many visit, and how many become customers.
Fields and controls:
- Total Monthly Crowd: addressable audience or reachable market size per month.
- Paid Traffic: visitors/users acquired through paid channels.
- Total Monthly Visitors: expected monthly visitors or users.
- Cost Per Visitor: acquisition cost per visitor.
- Monthly Conversion User That Buys: share of visitors who become paying customers.
- Total Monthly Customers: calculated customer count used by volume calculations.
- Sheet/table data: optional supporting rows for more detailed customer assumptions.
- Apply: writes changes to the source plan and recalculates customer-dependent sections.
Functionality:
- Customer assumptions feed Portfolio, Crowd/Visitors/Customers, Volume, and Net Sales.
- If conversion assumptions change, downstream product volume and revenue can change.
- Cost per visitor can later be reflected in acquisition and marketing-related analysis.
4. Portfolio
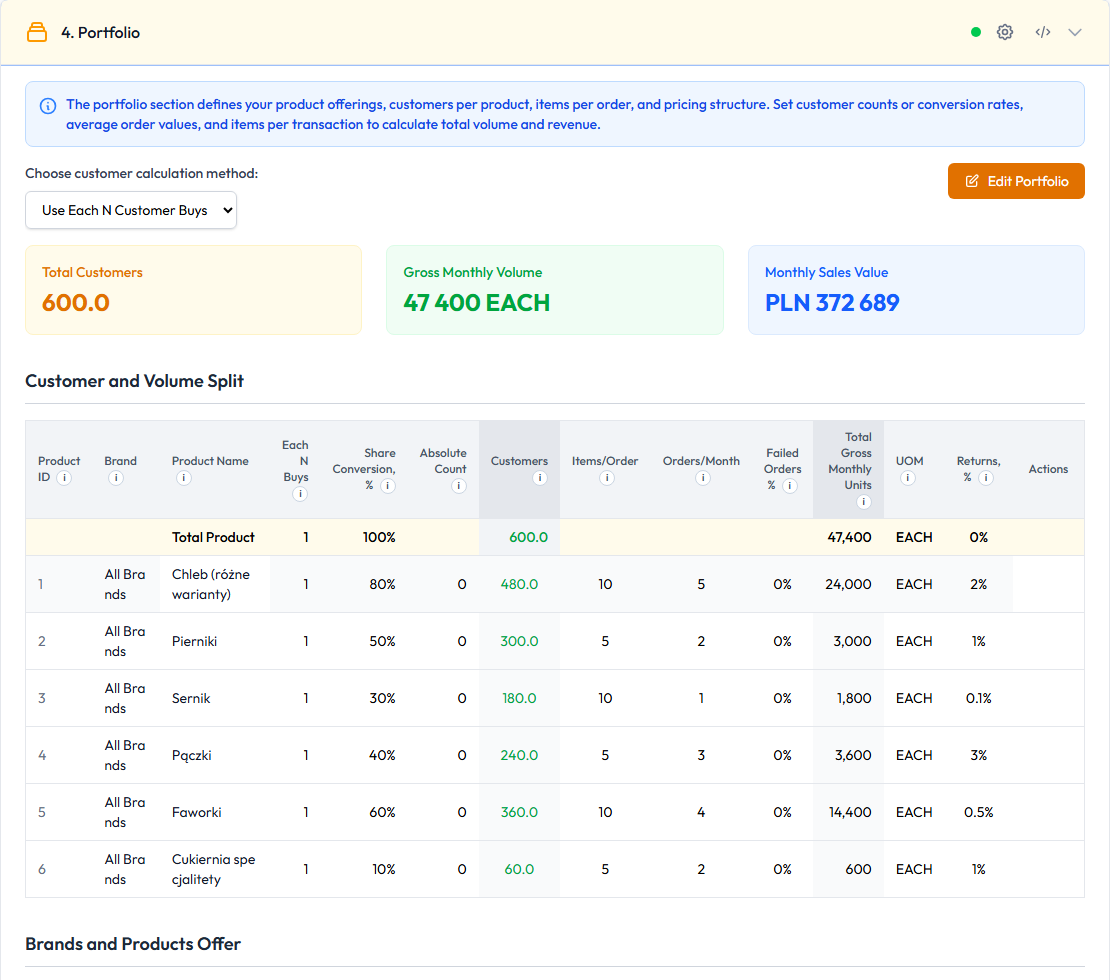
Portfolio defines what the business sells. It is one of the most important input sections because products and services drive pricing, volume, COGS, margins, investments, and revenue.
Input fields and controls:
- Product or Service Name: display name for each real offer.
- Brand: optional grouping or brand label.
- Cost: base unit cost before projected cost-price calculations.
- Price: base unit sales price before projected list-price calculations.
- Customer Calculation Method: controls how product customers are assigned, for example by share of total customers, percentage, or absolute count.
- Monthly Conversion User That Buys / Product Share: product-level share of the customer base when the model distributes total customers across products.
- Absolute Count Values: fixed customer count used when the absolute customer method is selected.
- Items Per Order: average units sold per order.
- Orders Per Customer Per Month: purchase frequency.
- Returns Percentage: expected share of returned orders/items.
- Standard Discount: default sales discount for the product.
- Initial Stock / Initial Stock Months: inventory assumptions used when initial stock should be included in asset calculations.
- Amortization Applied: whether depreciation/amortization logic applies to this product-related asset value.
- Beginning Month and Ending Month: active period for the row.
- Inflation Overrides: product-specific inflation or price increase settings when available.
Calculated fields:
- Customers: calculated from the Visitors and Customers total customer count and the selected customer calculation method. With share/percentage methods, product customers are based on the product share multiplied by total monthly customers. With absolute mode, the fixed absolute count is used.
- Total Units: calculated from customers, items per order, and orders per customer per month.
- Total Monthly Value: calculated from total units and price before downstream discounts, returns, and net-sales adjustments.
- Total Asset Value: calculated from product inventory/initial-stock assumptions and product cost; this feeds investment and CAPEX-related calculations when applicable.
- Product Markup: calculated from cost and price as profit over cost.
- Product Margin: calculated from cost and price as profit over selling price.
Total Product concept:
Total Productis the synthetic aggregate row at index0inproductsServices.- It is not a normal product or service to sell. Real products start after it, at index
1and onward. - The calculator uses
Total Productto hold rollups such as total customers, total units, total monthly value, total asset value, and weighted purchase frequency. - Cost Price and List Price calculations skip this row because aggregate totals do not have one meaningful unit cost or unit list price.
- Related sections such as Seasonality, Acceleration, Crowd/Visitors/Customers, Volume, and Sales Team Product Assignment use the row to align aggregate behavior with product-level behavior.
Functionality:
- Portfolio feeds Cost Price, List Price, Seasonality, Acceleration, Volume, Discounts, Net Sales, Gross Margin, Investments, and Sales Team Product Assignment.
- Each real product row can produce its own seasonality, volume, pricing, and margin behavior.
- The synthetic total product row is used for aggregate calculations and alignment.
5. Advanced Inflation Settings
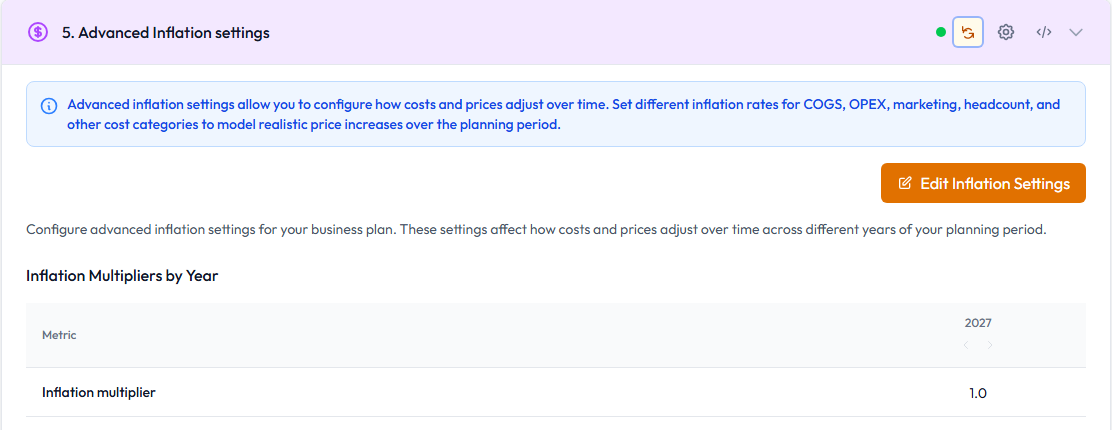
Advanced Inflation Settings expands the global inflation controls into year-level assumptions and multipliers. It is available only when Inflation Enabled is turned on in Business Plan Details.
Use this option carefully. For most public-facing or conservative plans, leaving inflation disabled is recommended because inflation and price-growth assumptions can make future values look more optimistic, especially revenue, price, and valuation-related outputs. Enable it only when the plan intentionally needs inflation, annual price increases, or salary-growth modeling and the assumptions can be explained.
Fields and controls:
- Inflation Enabled: switched on in Business Plan Details, not directly inside this section.
- Year List: years covered by the selected planning horizon.
- Yearly Inflation Rate: annual cost inflation assumption.
- Yearly Price Increase: annual sales price increase assumption.
- Yearly Salary Increase: annual payroll increase assumption.
- Inflation Multipliers: calculated values used to project amounts over time.
- Pivot/table output: shows the generated inflation values by year.
- Apply: writes edited year assumptions and recalculates downstream price, cost, and payroll sections.
Functionality:
- Cost Price and List Price use these settings to project product cost and sales prices.
- Headcount and Payroll can use salary increase settings.
- Disabling inflation in Business Plan Details keeps these projections flat and hides the editable Advanced Inflation table.
- Enabling inflation opens the Advanced Inflation section and lets users review or edit year-by-year multipliers.
6. Cost Price and List Price
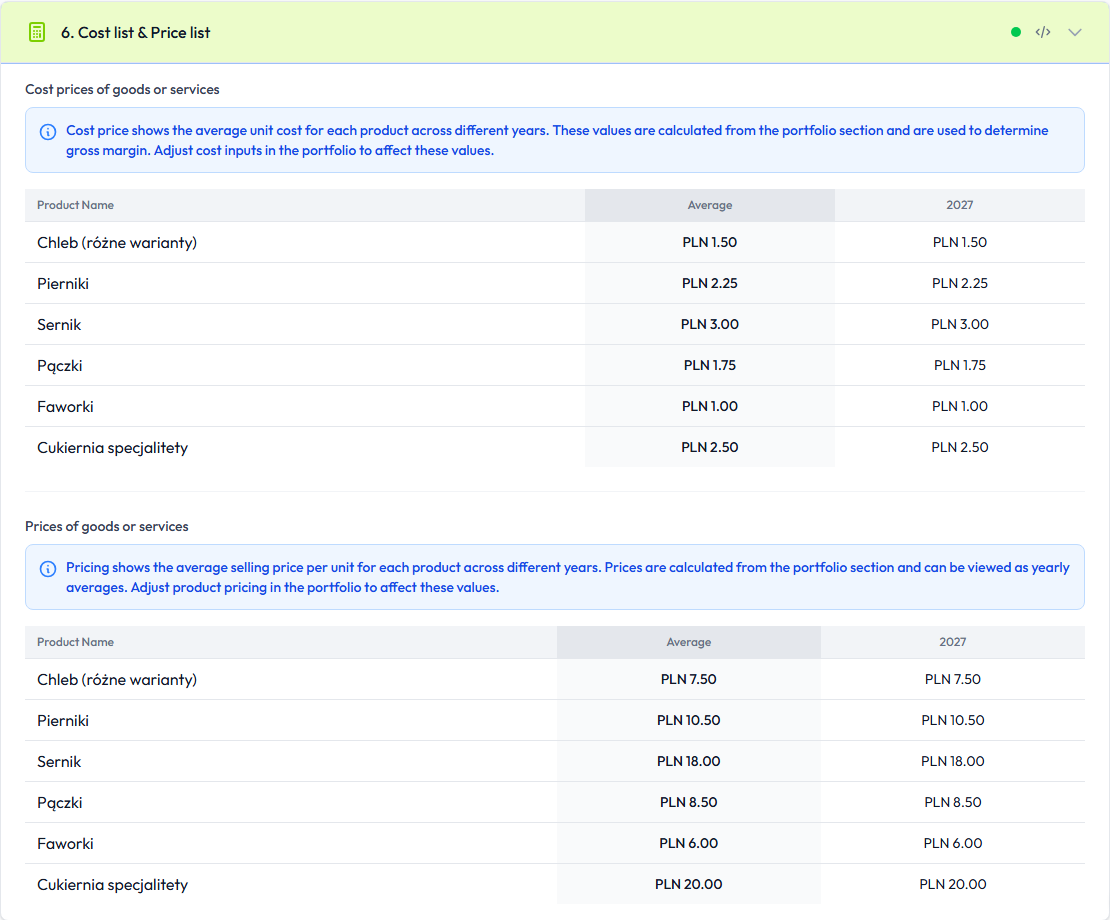
This section shows yearly projected unit costs and unit list prices. It bridges raw product assumptions and monthly financial calculations.
Fields and outputs:
- Cost Price table: calculated unit cost per product and year.
- List Price table: calculated sales/list price per product and year.
- Product rows: inherited from Portfolio.
- Year columns: inherited from Plan Details and Advanced Inflation.
- Table/Pivot controls: switch how projected values are displayed.
Functionality:
- Cost Price feeds Monthly COGS and Gross Margin.
- List Price feeds Net Sales and discount calculations.
- Inflation and price-increase assumptions determine whether values stay flat or grow by year.
7. Seasonality
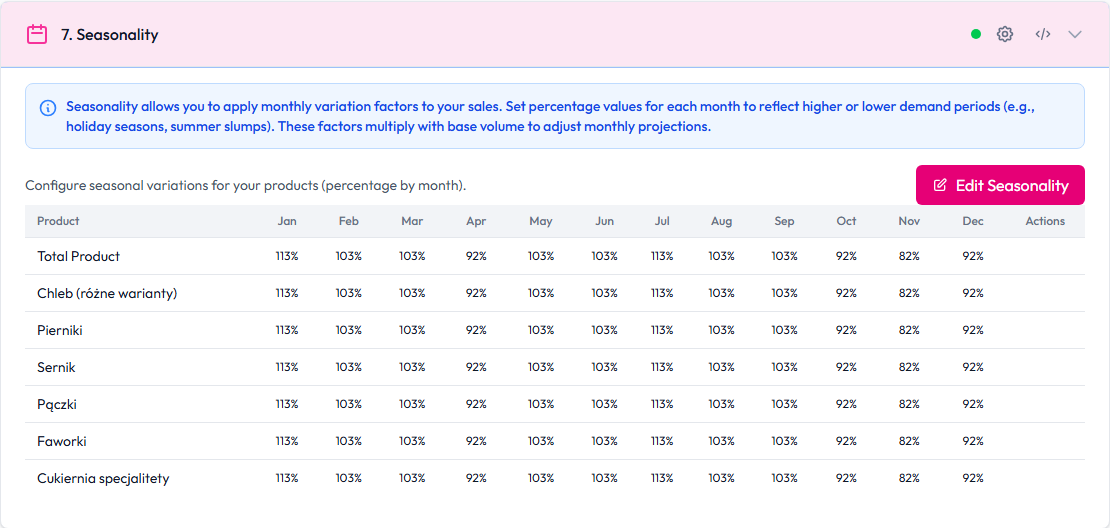
Seasonality controls how demand is distributed across the months of a year.
Fields and controls:
- Product: product or total-product row that receives seasonal weights.
- Monthly seasonality index: 12 values, usually one per calendar month.
- Total Product row: aggregate seasonal pattern.
- Per-product rows: product-specific seasonal behavior.
- Apply: updates seasonal weights and recalculates demand and volume timing.
Functionality:
- A value above
1increases demand for that month. - A value below
1reduces demand for that month. - Seasonality feeds Acceleration, Crowd/Visitors/Customers, Volume, Net Sales, and downstream margin calculations.
8. Acceleration
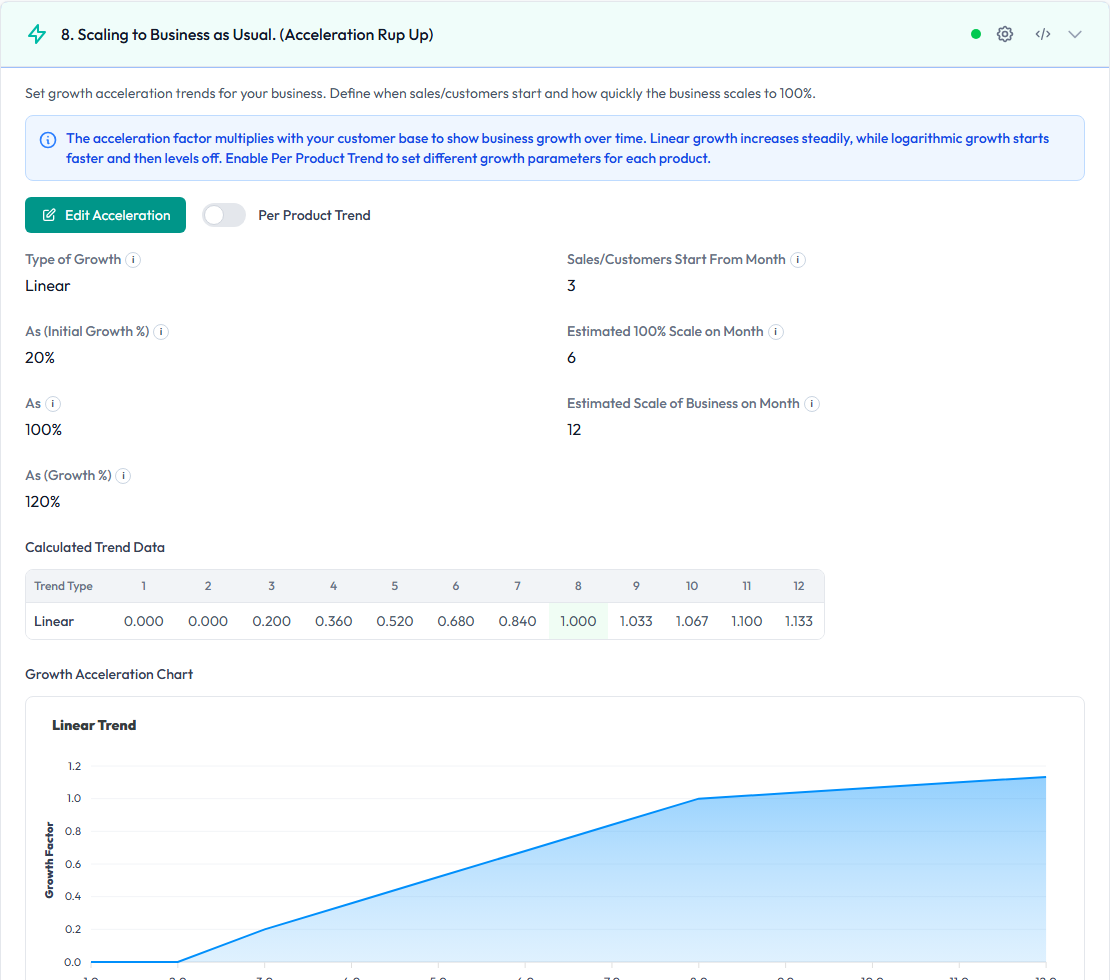
Acceleration models ramp-up from launch to normal business operation. It answers how quickly the business reaches its expected demand level.
Fields and controls:
- Trend Type: growth model used for the ramp curve.
- Trend Months: control points for the ramp.
- Growth Values: expected growth level at each control point.
- Per Product Trend: allows separate ramp settings per product when enabled.
- Trend Data: calculated curve used by demand and volume sections.
Functionality:
- Early-month growth is usually below full steady-state demand.
- Acceleration combines with seasonality to shape monthly demand.
- Changes affect Crowd/Visitors/Customers, Volume, Net Sales, COGS, Gross Margin, EBIT, and Cash Flow.
9. Headcount and Payroll
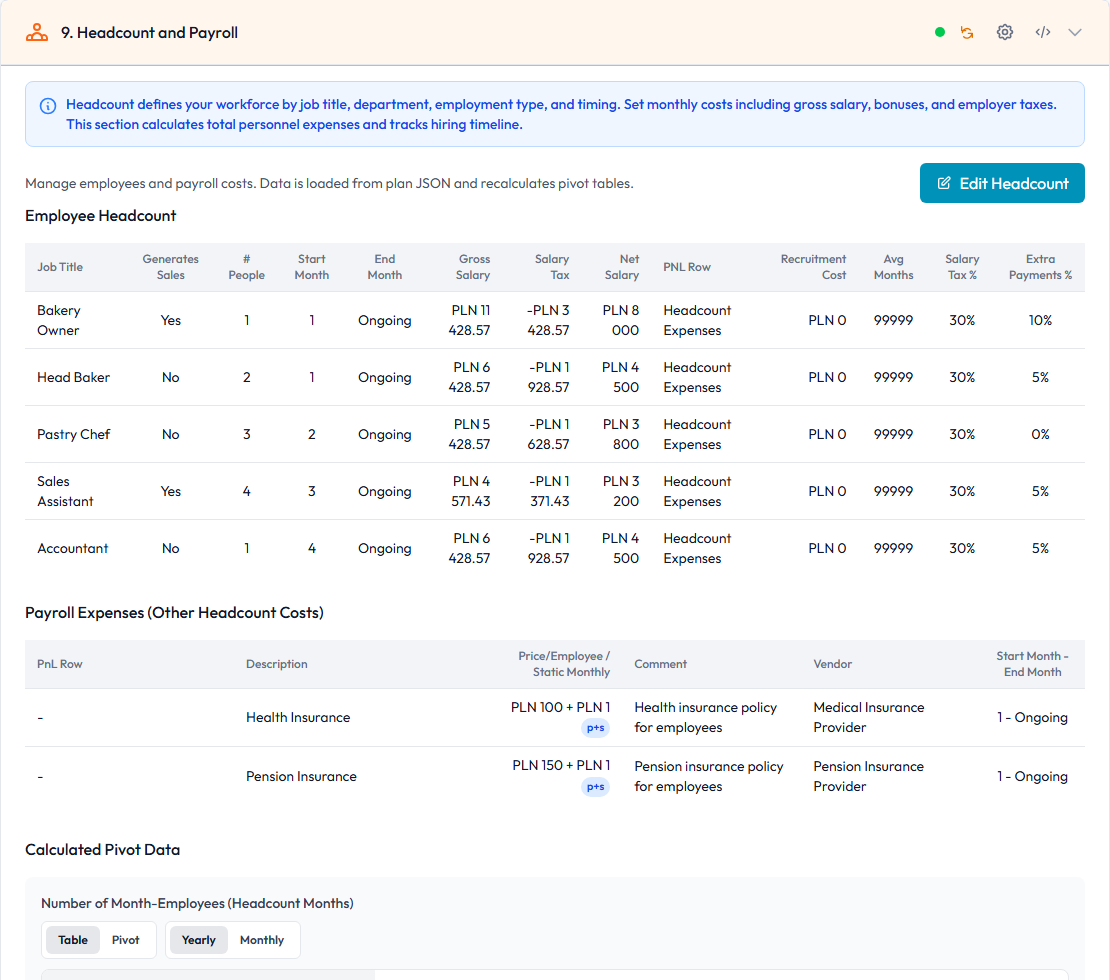
Headcount and Payroll models employees, employment timing, salary, payroll taxes, recruitment, and extra personnel costs.
Employee fields:
- Job Title: role name, such as baker, sales assistant, or accountant.
- Generates Sales: marks roles that can be used by sales-team assignment.
- Number of People: headcount for the role.
- Start Month and End Month: active months for the role.
- Gross Salary: base salary cost.
- Salary Tax: employer or tax-related salary cost.
- Net Salary: salary amount after configured tax treatment.
- PNL Row: whether the role belongs to operating expenses or COGS-related headcount.
- Recruitment Cost: one-time or role-level hiring cost.
- Average Months: averaging or duration helper used in payroll calculations.
- Salary Tax % and Extra Payments %: percentage assumptions applied to salary.
Payroll expense fields:
- PNL Row: expense classification.
- Description: name of the payroll cost, such as insurance or pension.
- Price/Employee or Static Monthly: per-employee or fixed monthly cost.
- Comment and Vendor: explanatory details.
- Start Month and End Month: active timing.
Functionality:
- Headcount expenses feed All Monthly Expenses and Monthly COGS depending on the PNL row.
- Sales-generating roles can drive Sales Team Product Assignment.
- Pivot outputs show employee-month counts and payroll totals over time.
10. Churn Attrition Rate
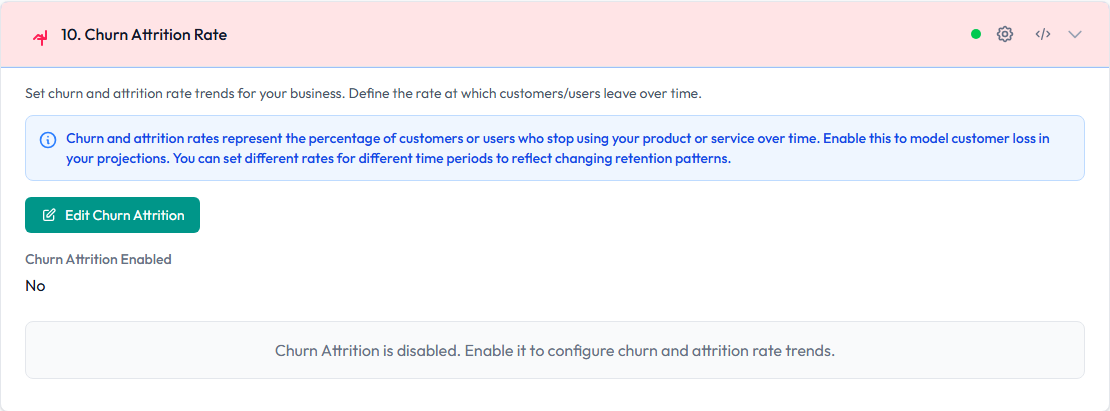
Churn Attrition Rate captures customer loss assumptions. It is most relevant for recurring, subscription, membership, or repeat-purchase businesses.
Fields and controls:
- Churn or attrition percentage: expected customer loss rate.
- Product/customer context: identifies which customer base the churn applies to.
- Timing controls: define when the churn assumption starts or ends when available.
- Apply: updates customer-retention assumptions.
Functionality:
- Churn reduces retained customer volume over time.
- Churn feeds Crowd/Visitors/Customers and Volume.
- Lower churn generally improves recurring volume, Net Sales, Gross Margin, EBIT, and Cash Flow.
11. Sales Team Product Assignment
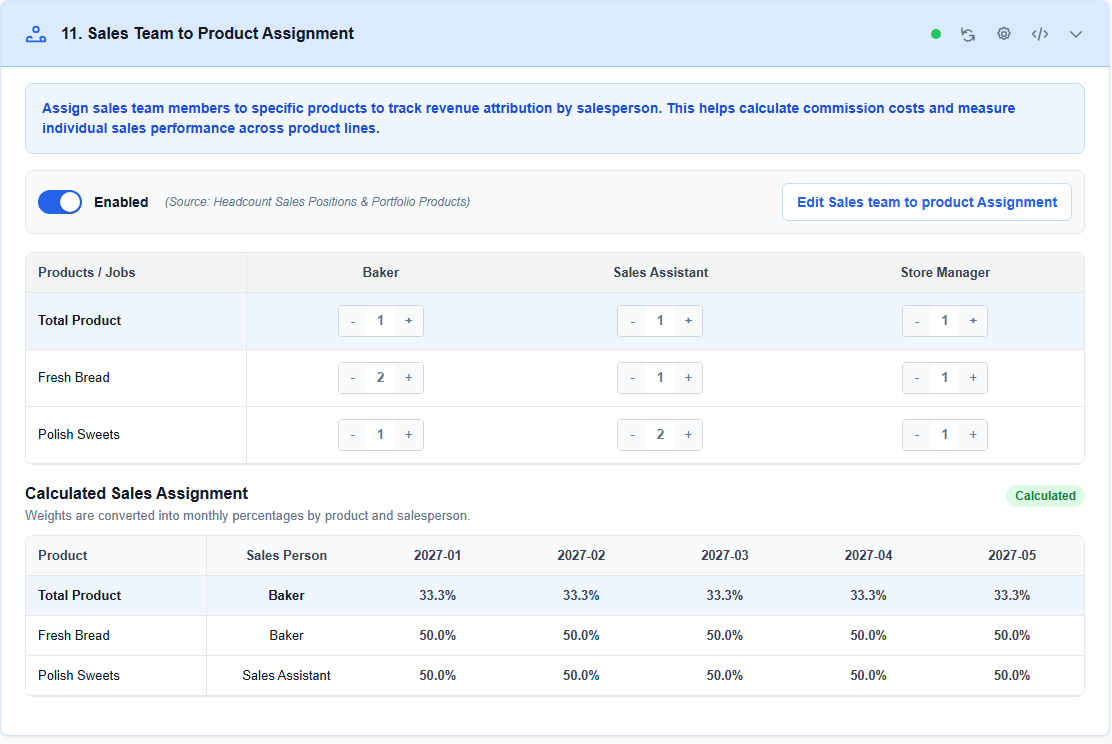
Sales Team Product Assignment allocates sales-team effort to products. It is useful when product demand depends on sales capacity or when the team wants to attribute product revenue to specific sales roles.
By default, this section is disabled. Leave it disabled when product demand should be calculated only from visitors, customers, portfolio assumptions, seasonality, acceleration, and churn. Enable it only when sales-capacity allocation matters for the plan.
Fields and controls:
- Enabled: turns assignment logic on or off. The toggle can be changed after entering edit mode.
- Source: shows that the section is built from Headcount sales positions and Portfolio products.
- Job Title Columns: sales-related roles from Headcount and Payroll. A job title appears here only when the headcount row is marked as generating sales.
- Product Rows: product and service rows from Portfolio. The
Total Productrow appears first as the aggregate row, followed by real product rows. - Matrix Cells: numeric weights that assign each sales role to each product. Higher numbers give that role more influence for that product.
- Plus and Minus Steppers: increase or decrease a matrix weight while editing.
- Populate Direction Buttons: in edit mode, small arrow controls can copy a cell value left, right, up, or down to speed up matrix entry.
- Apply: saves the enabled flag and matrix weights into the business plan source data.
- Cancel: exits edit mode and restores the previous saved matrix values.
- Calculated Sales Assignment: converts matrix weights into monthly percentage allocations by product and salesperson.
Functionality:
- When disabled, the section shows only an empty-state hint and does not affect product/customer distribution.
- When enabled, the calculator builds the matrix from sales-generating job titles and portfolio products.
- The calculated table translates row weights into percentages for every modeled month.
- If Headcount and Payroll changes, for example a new role is marked as generating sales, this section should be recalculated.
- If Portfolio changes, for example a new product is added, this section should be recalculated so the product appears in the matrix.
- Output feeds Crowd/Visitors/Customers and product-level volume allocation.
12. Targeted Audience, Visitors/Users, Customers
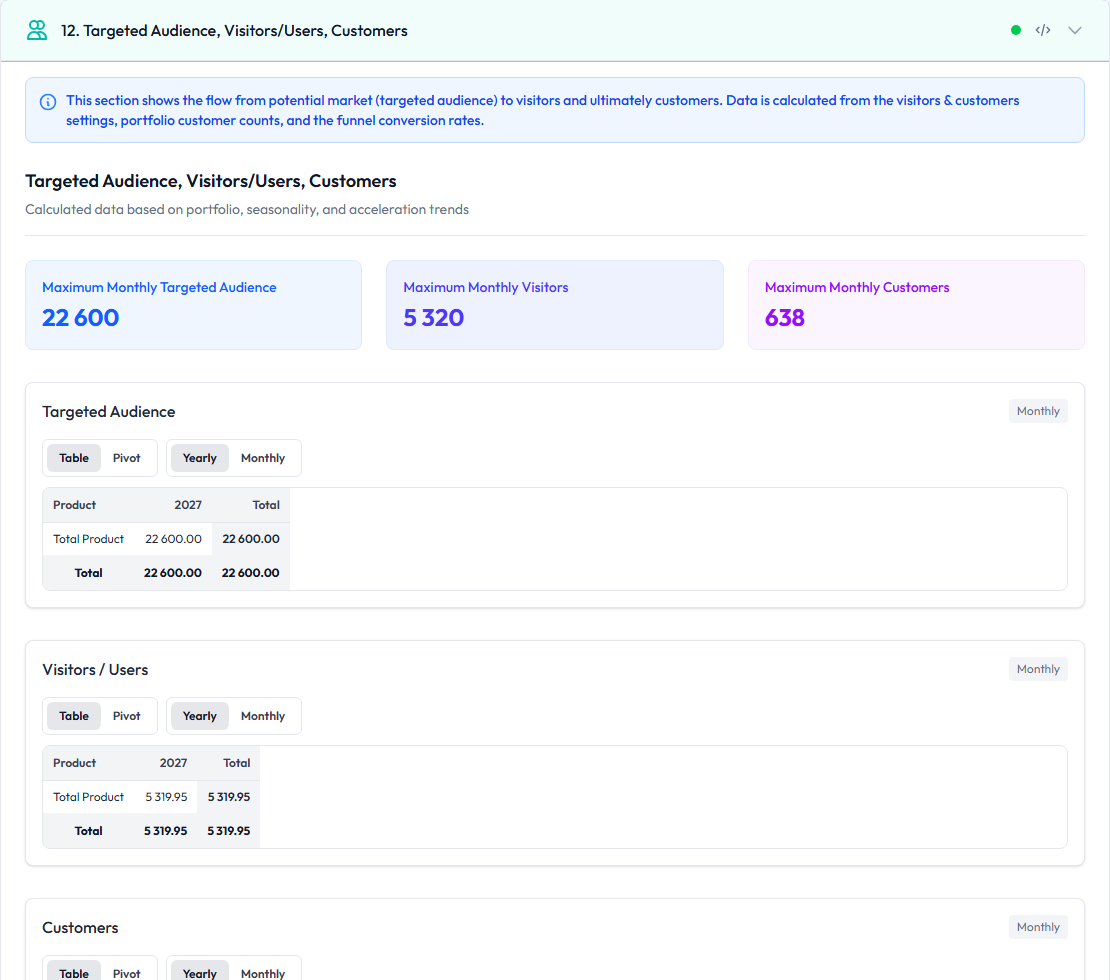
This calculated section turns funnel assumptions into monthly customer-facing outputs.
Outputs:
- Crowd: reachable market or audience by period.
- Visitors/Users: projected traffic or users by period.
- Customers: converted customers by period.
- Product/customer distribution: allocation by product when product-level inputs exist.
- Pivot controls: switch between table and pivot views, and yearly/monthly display.
Functionality:
- Combines Visitors and Customers, Seasonality, Acceleration, Churn, Portfolio, and Sales Team Assignment.
- Provides the customer base used by Volume.
- Helps verify whether demand assumptions look realistic before reviewing revenue.
13. Monthly Volume
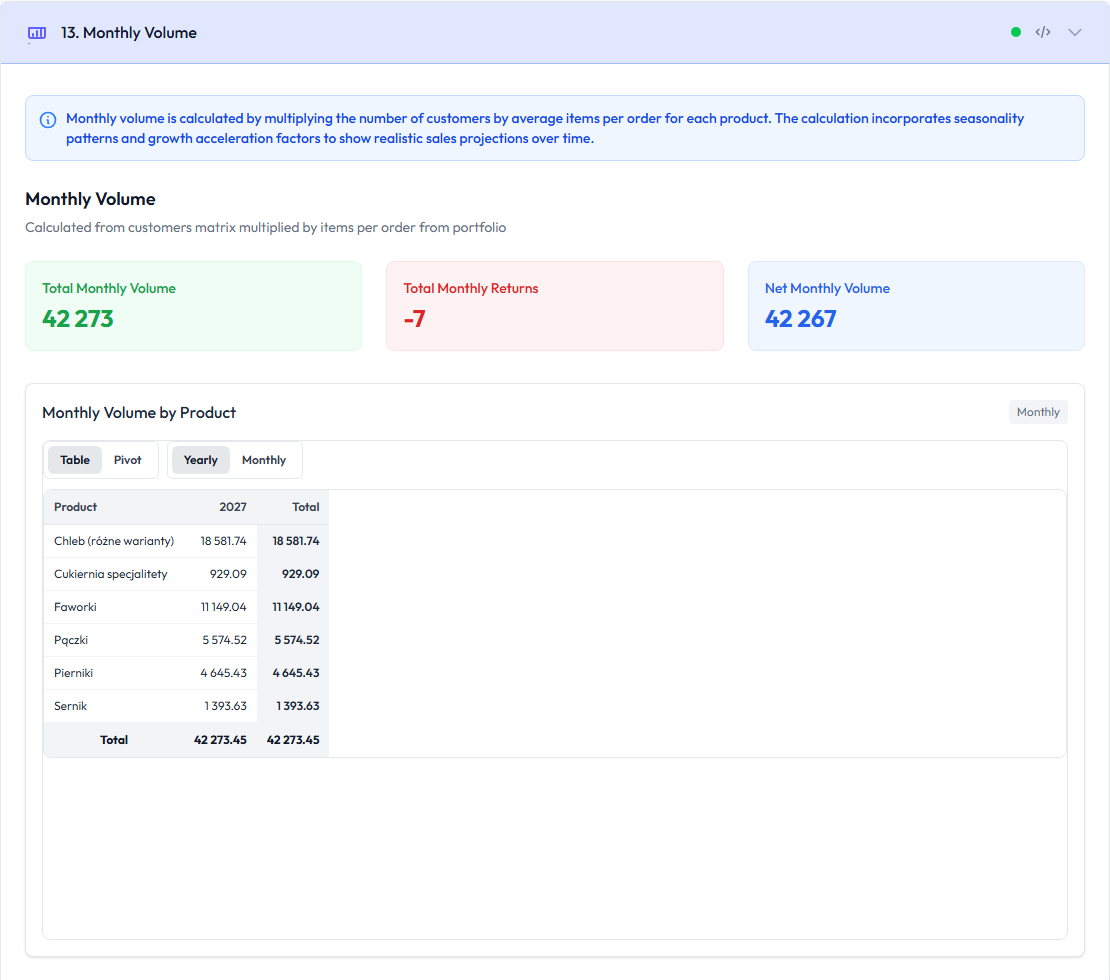
Monthly Volume calculates units sold or service volume by product and period.
Outputs:
- Product volume: expected monthly quantity per product.
- Total volume: aggregate product/service volume.
- Units per order and order frequency effects: inherited from Portfolio.
- Seasonality and acceleration effects: demand timing from earlier sections.
- Pivot/table controls: yearly and monthly views.
Functionality:
- Volume is a key driver for Net Sales, Monthly COGS, Gross Margin, and Cash Flow.
- If product price is unchanged but volume changes, revenue changes directly.
- If cost per unit is unchanged but volume changes, COGS changes directly.
14. Discounts and Returns
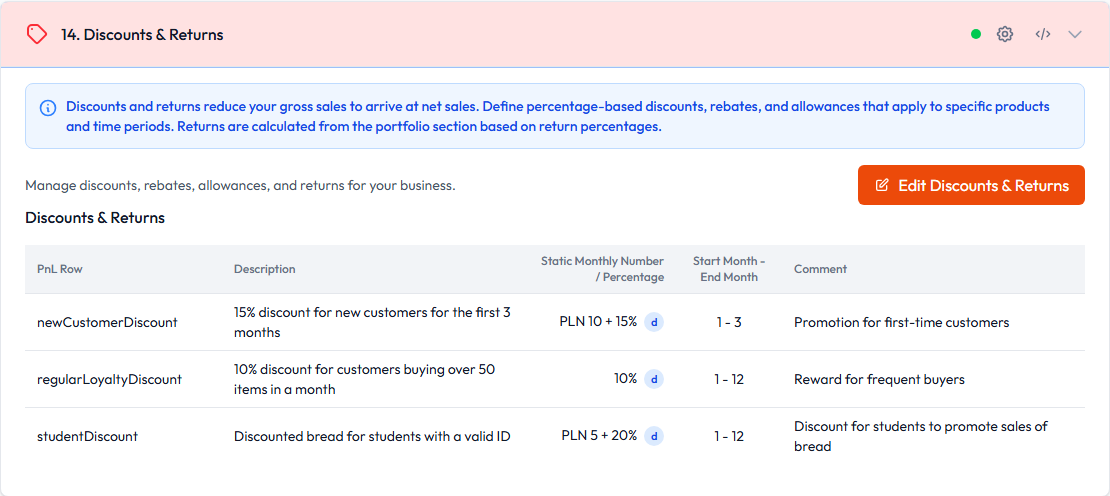
Discounts and Returns models reductions from gross sales.
Fields and controls:
- PNL Row or category: type of reduction.
- Description: business explanation for the discount or return.
- Static Monthly Number: fixed monthly amount when applicable.
- Percentage: variable reduction rate.
- Vendor or counterparty: optional context.
- Start Month and End Month: active months.
- Comments: additional explanation.
Functionality:
- Discounts reduce sales value before net sales.
- Returns reduce recognized revenue and can affect volume/value analysis.
- Output feeds Net Sales and downstream margin calculations.
15. Net Sales Revenue
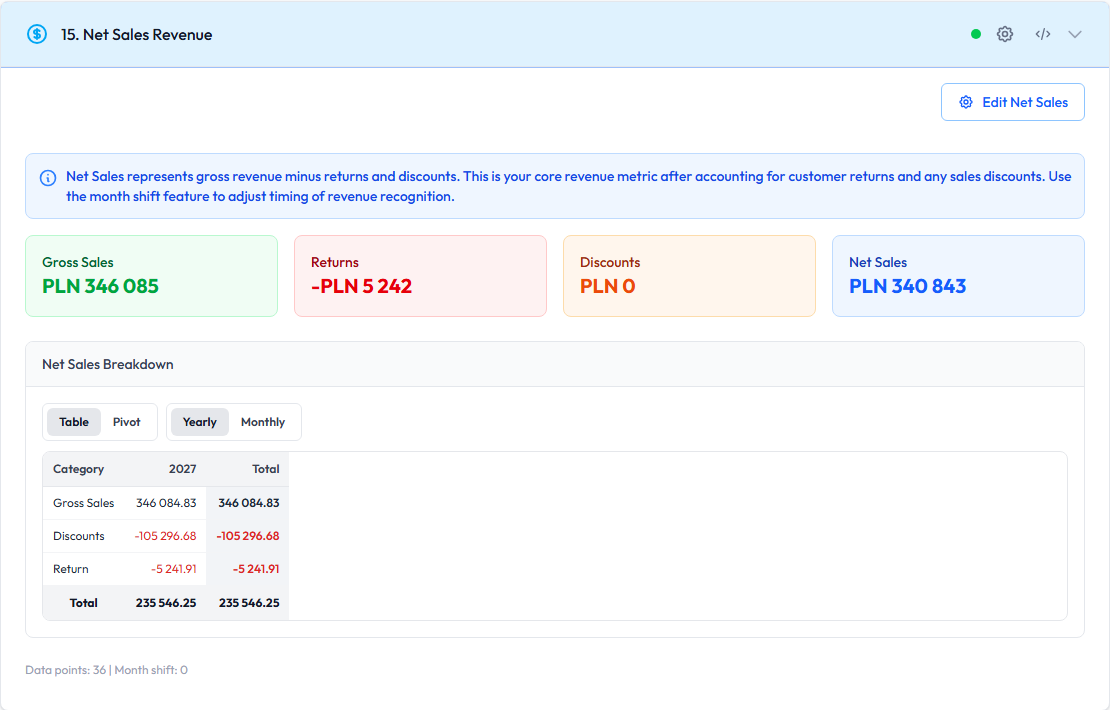
Net Sales Revenue converts gross product sales into revenue after discounts, returns, and timeline alignment.
Fields and outputs:
- Gross Sales: volume multiplied by list price before reductions.
- Discounts: reductions from discount rules.
- Returns: reductions from return assumptions.
- Net Sales: final revenue after reductions.
- Month Shift: optional timing shift for recognizing sales.
- Pivot/table controls: monthly and yearly revenue views.
Functionality:
- Net Sales feeds Monthly COGS, Gross Margin, EBIT, Investments Required, Cash Flow, Analytics, and exports.
- This is usually the main revenue section to review after changing demand, products, price, discount, or return assumptions.
16. Monthly COGS
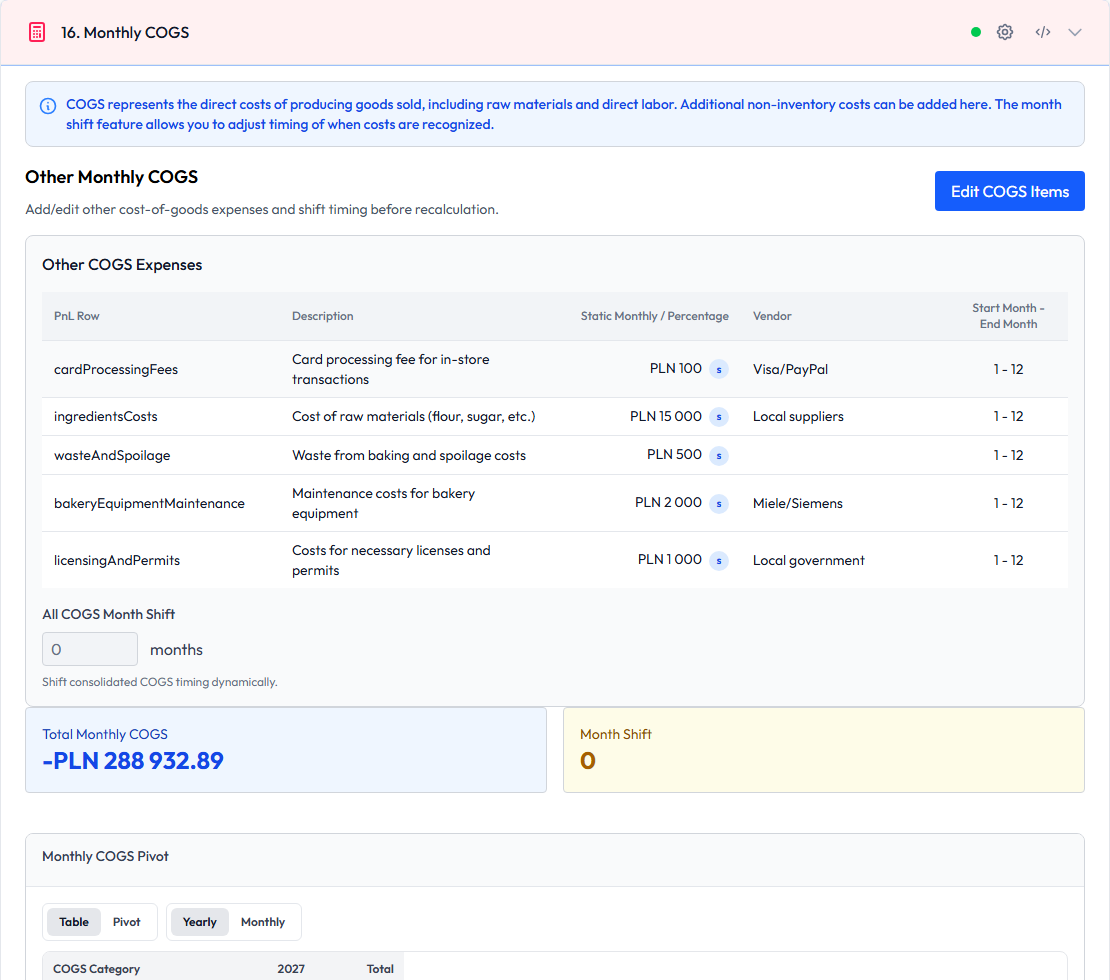
Monthly COGS calculates product-related cost of goods sold and COGS-related headcount costs.
Outputs:
- Product COGS: volume multiplied by projected cost price.
- Headcount COGS: payroll rows classified as COGS.
- Monthly COGS Pivot: cost by product, category, and period.
- Total COGS: aggregate cost feeding Gross Margin.
Functionality:
- Uses Volume, Cost Price, Net Sales, and Headcount.
- Separates operational payroll from COGS-related payroll using PNL row classification.
- Feeds Gross Margin and Cash Flow.
17. Gross Margin
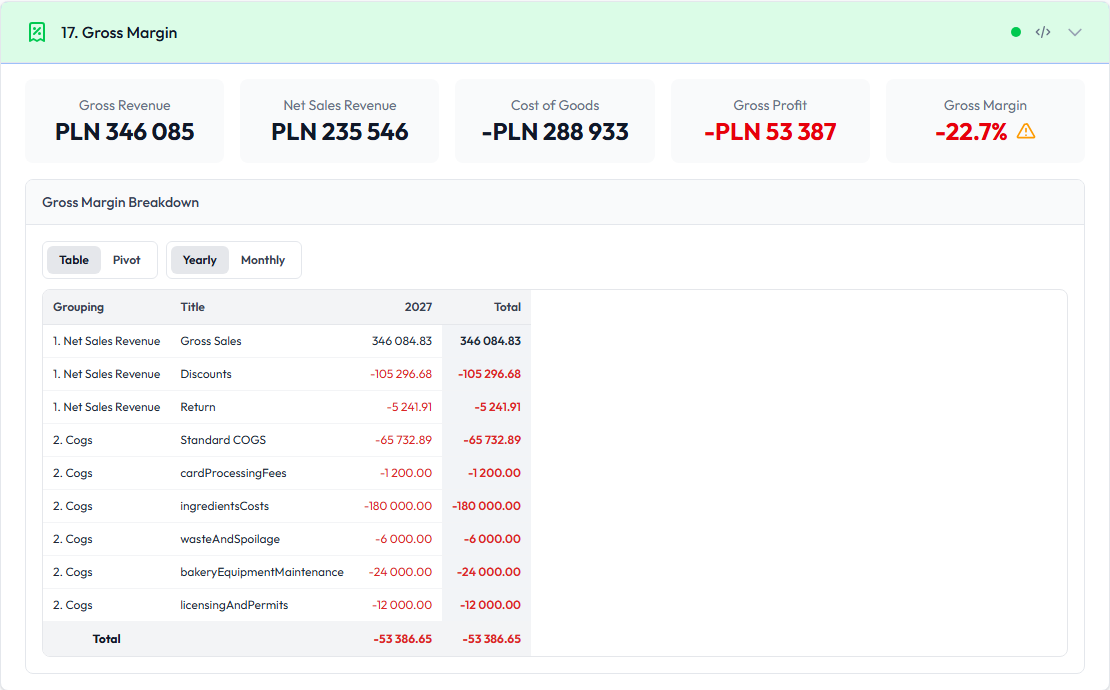
Gross Margin shows profitability after direct costs but before operating expenses and investments.
Outputs:
- Net Sales: revenue after discounts and returns.
- COGS: direct cost of goods sold.
- Gross Profit: net sales minus COGS.
- Gross Margin %: gross profit divided by net sales.
- Pivot/table views: period-level margin breakdown.
Functionality:
- Gross Margin is a key health check for product economics.
- Negative gross margin means the product/service model loses money before operating expenses.
- Gross Margin feeds EBIT, Investments Required, Cash Flow, and Summary.
18. Investments and CAPEX
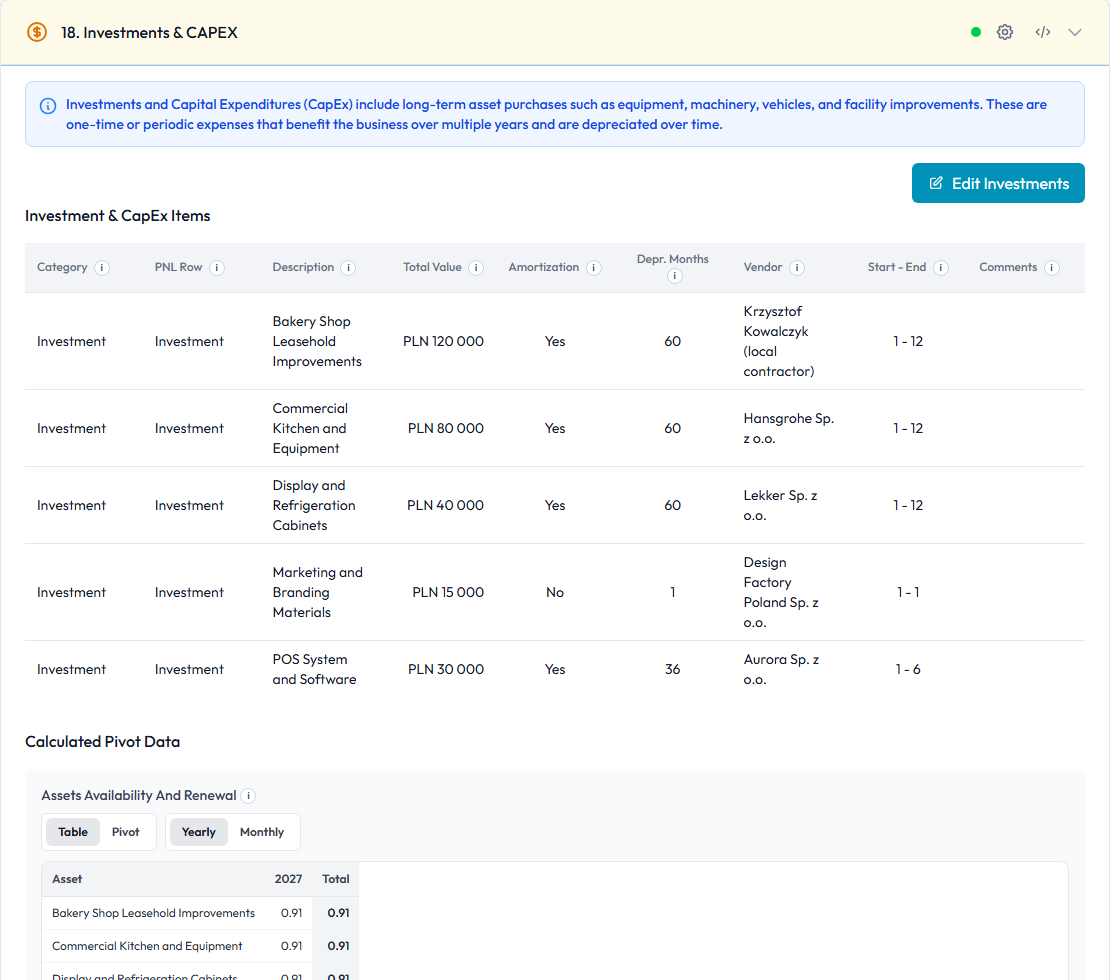
Investments and CAPEX captures long-term asset purchases and investment spending.
Fields:
- Category: investment grouping.
- PNL Row: financial classification.
- Description: asset or investment name.
- Total Value: total investment amount.
- Amortization: whether depreciation/amortization is applied.
- Depreciation Months: number of months for depreciation.
- Vendor: supplier or contractor.
- Start and End: active investment timing.
- Comments: supporting notes.
Functionality:
- Investment spending feeds Cash Flow and Investments Required.
- Depreciation/amortization feeds EBIT.
- Asset availability and renewal pivots help review how assets exist across the timeline.
19. Marketing
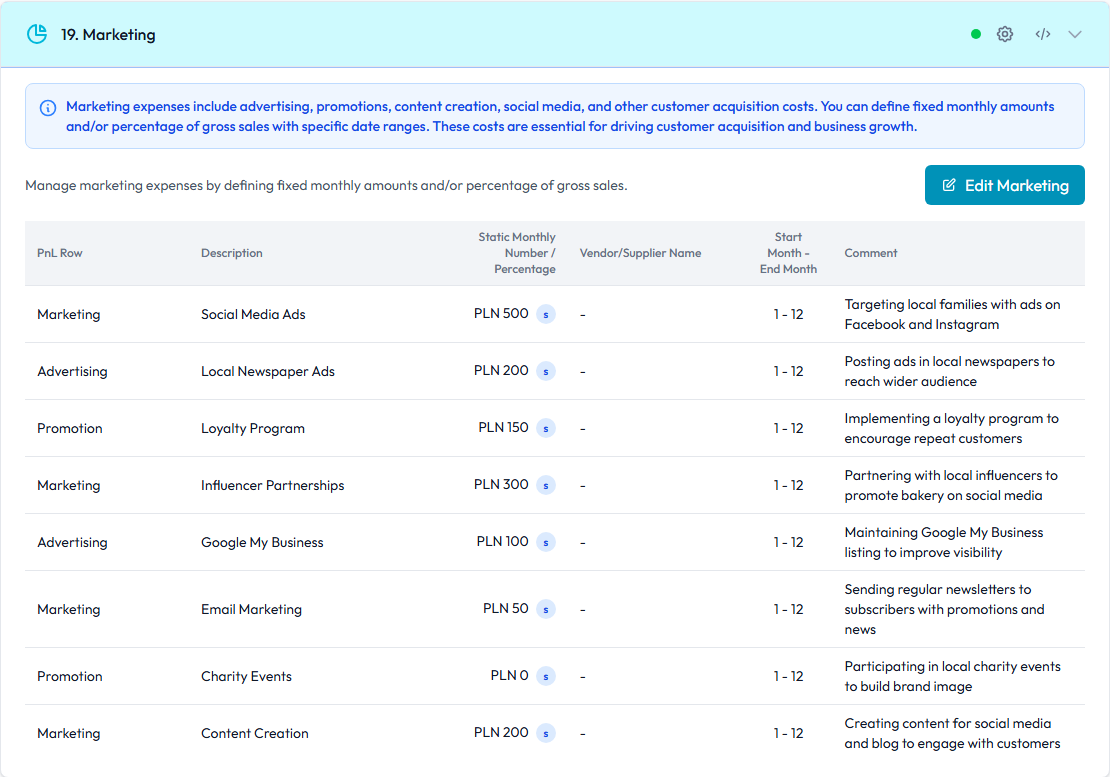
Marketing records marketing costs such as campaigns, agencies, channels, promotions, and launch spend.
Fields:
- PNL Row: marketing category.
- Description: campaign or expense name.
- Static Monthly Number: fixed monthly marketing amount.
- Percentage: variable marketing assumption when tied to another driver.
- Vendor: marketing supplier or channel.
- Start Month and End Month: active timing.
- Comments: notes for the expense.
Functionality:
- Marketing feeds All Monthly Expenses, EBIT, Investments Required, Cash Flow, and Summary.
- Timing matters: launch-heavy spend can create early cash pressure even if later periods are profitable.
20. OPEX
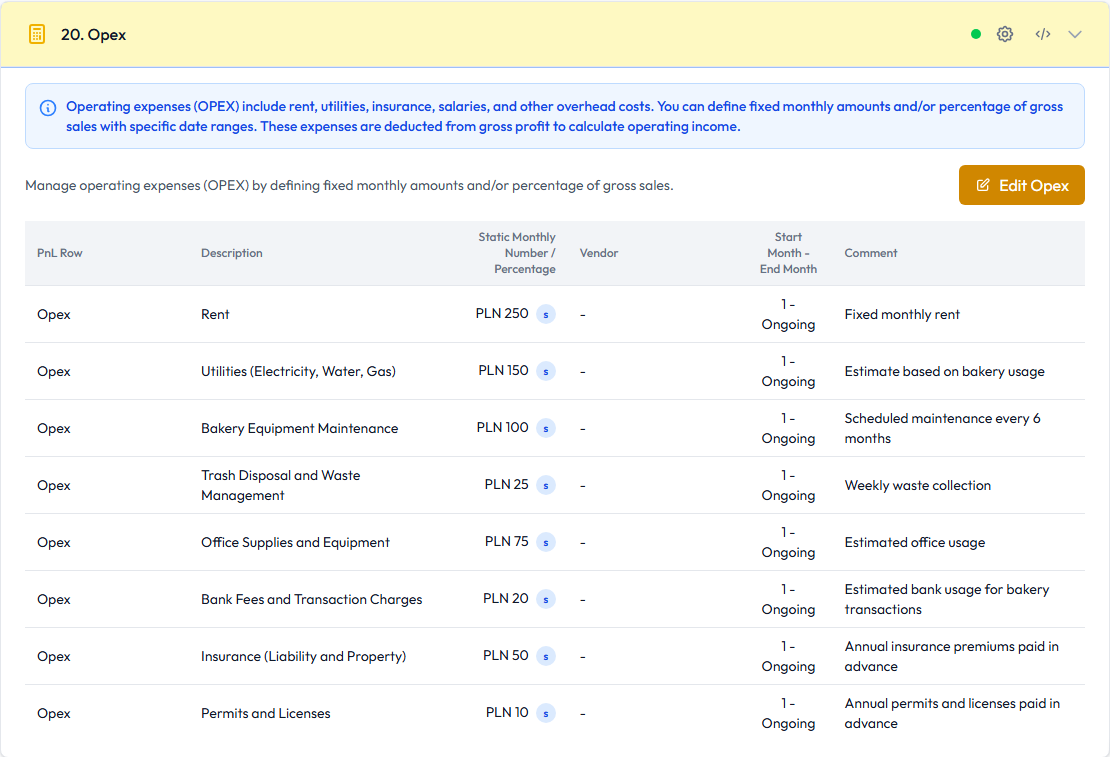
OPEX models recurring operating expenses that are not direct product costs, payroll, R&D, marketing, or other operating income/loss.
Fields:
- PNL Row: operating expense category.
- Description: cost name.
- Static Monthly Number: fixed monthly cost.
- Percentage: variable operating cost assumption.
- Vendor: supplier or counterparty.
- Start Month and End Month: active timing.
- Comments: notes for review.
Functionality:
- OPEX feeds All Monthly Expenses and EBIT.
- Examples include rent, utilities, software, accounting, administration, insurance, and office costs.
- Timing controls allow expenses to start before or after revenue begins.
21. R&D
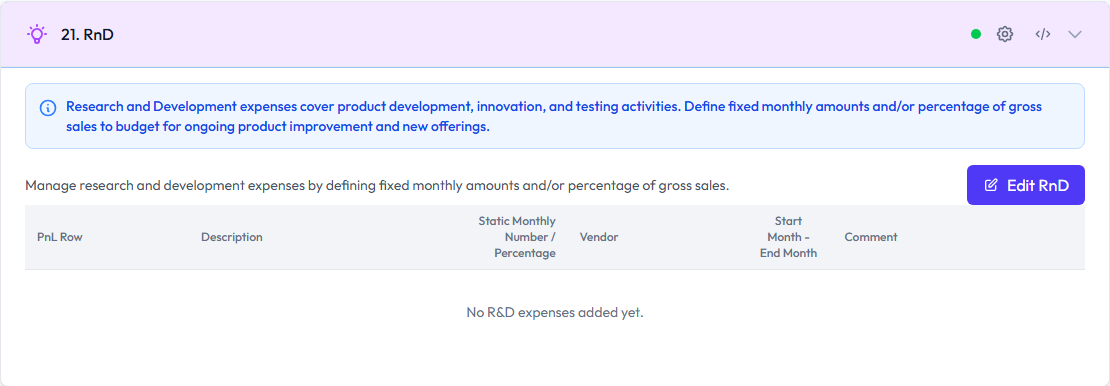
R&D captures research and development costs.
Fields:
- PNL Row: R&D category.
- Description: research activity, prototype, development project, or lab cost.
- Static Monthly Number: fixed monthly R&D spend.
- Percentage: variable R&D assumption where applicable.
- Vendor: supplier or contractor.
- Start Month and End Month: active timing.
- Comments: explanation or assumptions.
Functionality:
- R&D feeds All Monthly Expenses, EBIT, Investments Required, Cash Flow, and Summary.
- It is useful for product, software, technical, scientific, or innovation-driven businesses.
22. Other Operating Income/Loss
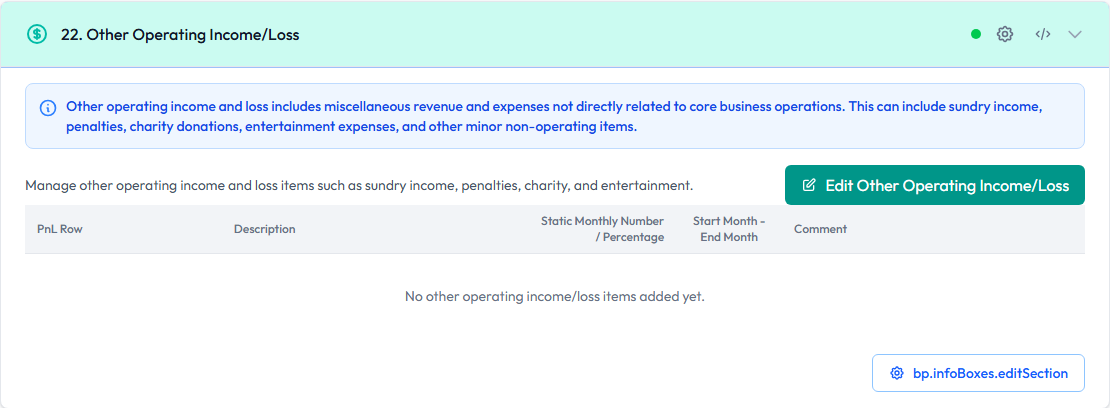
Other Operating Income/Loss records operating items that do not fit normal sales, COGS, OPEX, marketing, R&D, or payroll categories.
Fields:
- PNL Row: income or loss classification.
- Description: item name.
- Static Monthly Number: recurring amount.
- Percentage: variable amount where applicable.
- Vendor or counterparty: related organization.
- Start Month and End Month: active timing.
- Comments: notes for reviewers.
Functionality:
- Positive values can represent recurring operating income outside sales.
- Negative values can represent operating losses or unusual costs.
- The section feeds All Monthly Expenses and EBIT.
23. All Monthly Expenses
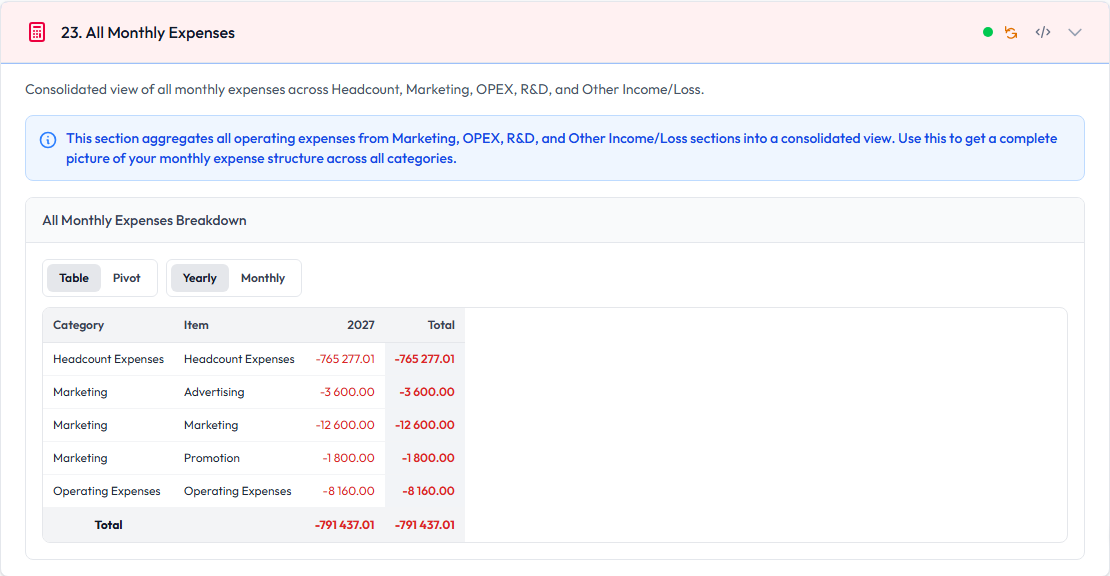
All Monthly Expenses consolidates operating expense sections into one calculated view.
Outputs:
- OPEX totals.
- Marketing totals.
- R&D totals.
- Other operating income/loss.
- Non-COGS headcount and payroll costs.
- Monthly and yearly pivots.
Functionality:
- This section is calculated from upstream expense sections.
- It is the main checkpoint before reviewing EBIT.
- Expense timing here affects Cash Flow and funding requirements.
24. EBIT Operating Profit
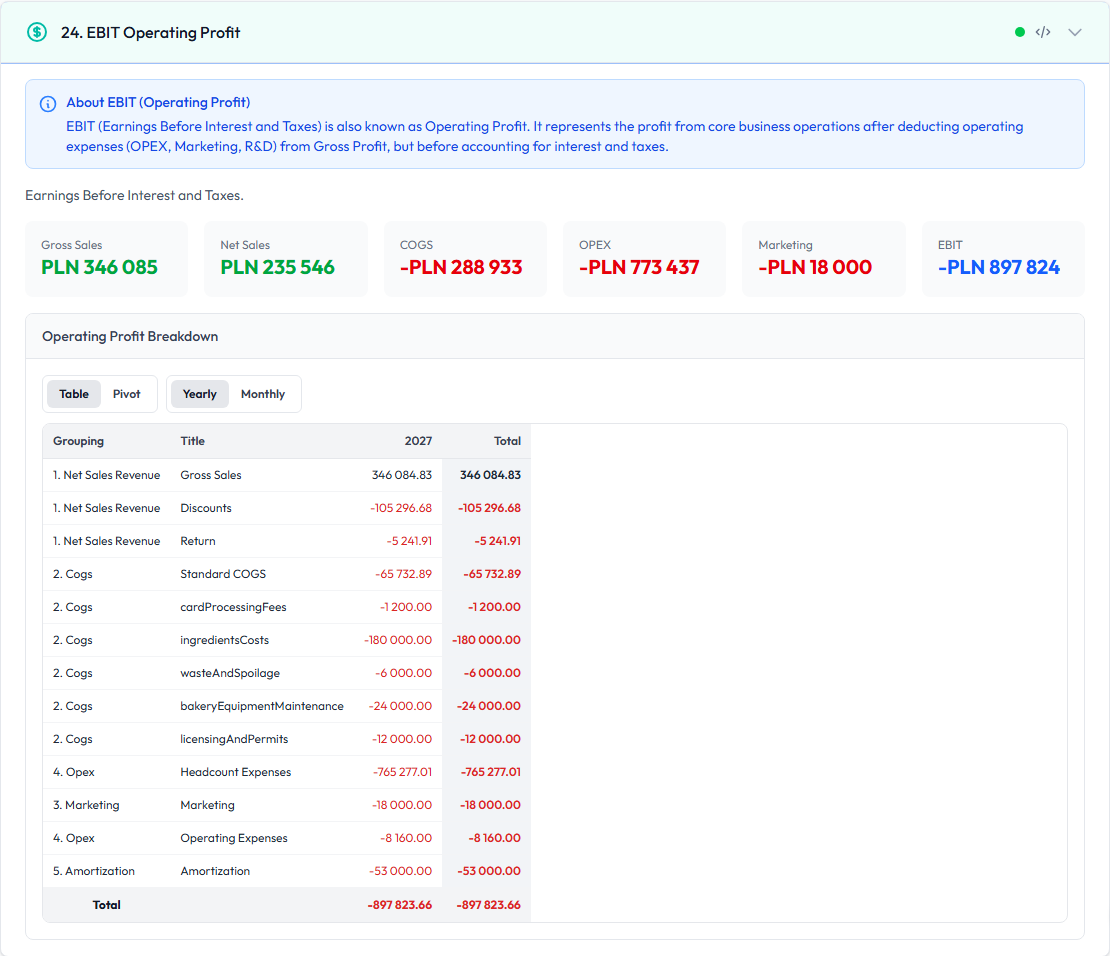
EBIT Operating Profit calculates operating profit before financing effects.
Outputs:
- Gross Sales: top-line gross revenue.
- Net Sales: revenue after discounts and returns.
- COGS: direct product and COGS-headcount costs.
- OPEX, Marketing, R&D, and other expenses: operating expense inputs.
- Amortization/depreciation: investment-related non-cash cost when applicable.
- EBIT: operating profit.
- Breakdown pivot: period-level EBIT composition.
Functionality:
- EBIT is derived from Gross Margin, All Monthly Expenses, and investment depreciation.
- Positive EBIT indicates the plan becomes operationally profitable in that period.
- EBIT feeds Investments Required, Cash Flow, Analytics, and Summary.
25. Investments Required
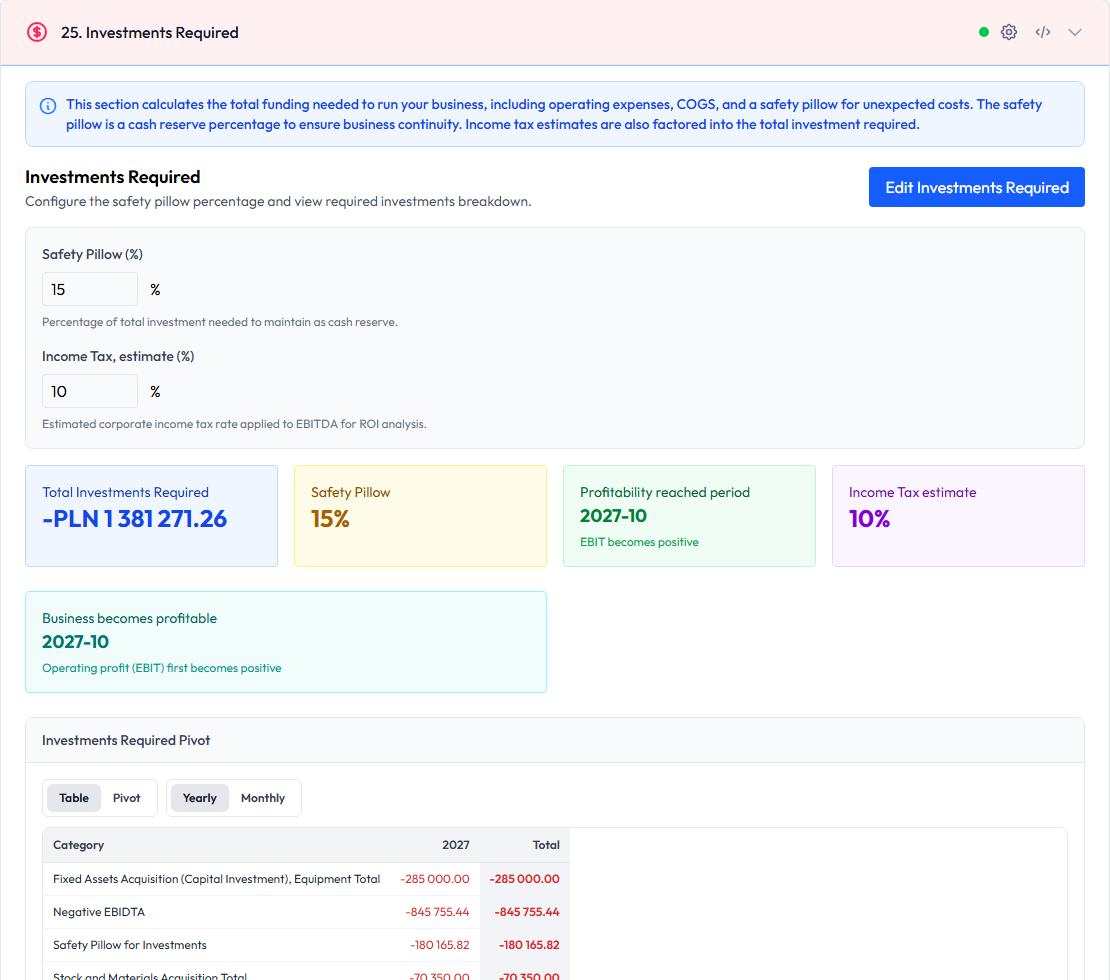
Investments Required estimates the funding needed to run the plan.
Fields and outputs:
- Safety Pillow (%): extra cash reserve percentage added to funding needs.
- Income Tax Estimate (%): tax assumption used in ROI and profitability analysis.
- Total Investments Required: total funding need based on investments, losses, and reserve.
- Safety Pillow card: shows the configured reserve.
- Profitability Reached Period: first period where profitability is reached.
- Business Becomes Profitable: first period where operating profit becomes positive.
- Investments Required Pivot: breakdown of funding components.
- ROI analysis outputs: return and recovery milestones when available.
Functionality:
- Uses EBIT, investment spending, operating losses, taxes, and safety buffer.
- Helps estimate how much capital is needed before the business becomes self-sustaining.
- Feeds Cash Flow and Summary.
26. Cash Flow
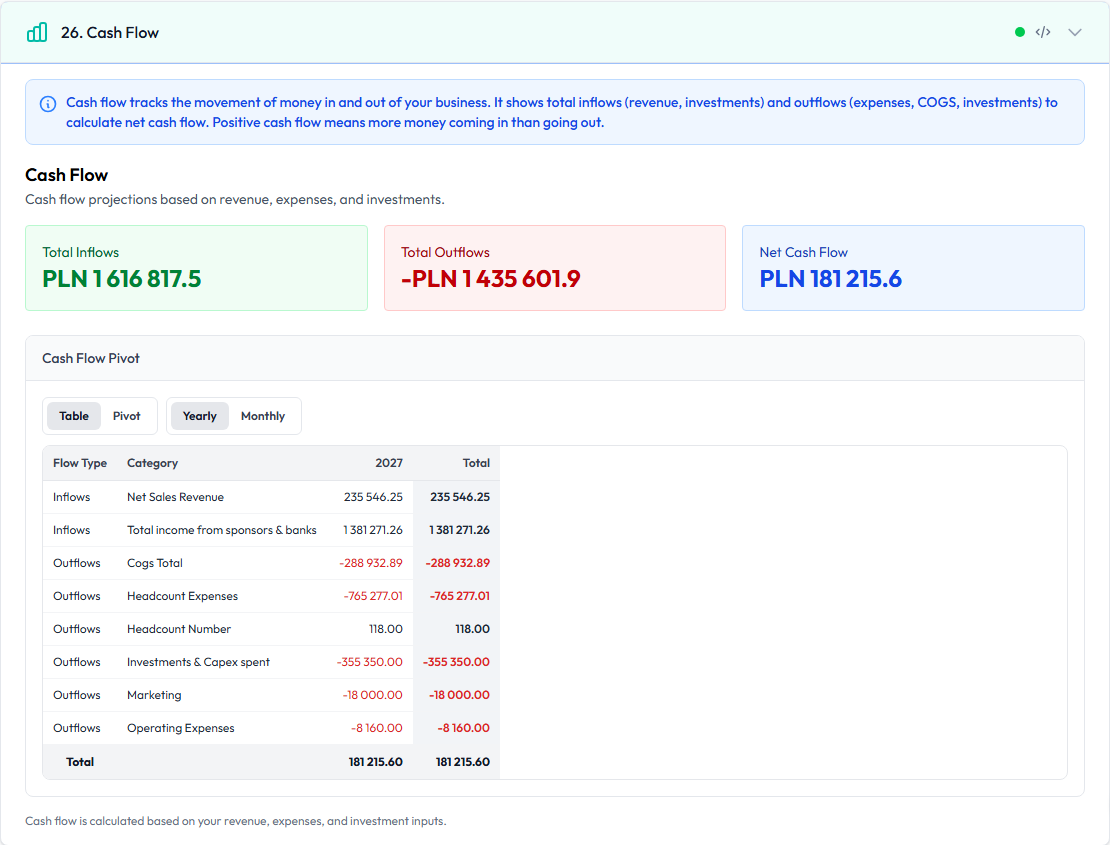
Cash Flow models liquidity timing: when money comes in, when it goes out, and whether the business has enough cash.
Outputs:
- Cash inflows: revenue and funding-related inflows.
- Cash outflows: COGS, expenses, investments, and other cash costs.
- Net cash flow: inflows minus outflows.
- Cumulative cash position: running cash balance.
- Monthly and yearly pivot/export rows.
Functionality:
- Cash Flow uses Net Sales, Cost Price, Gross Margin, All Monthly Expenses, Investments, and Investments Required.
- A profitable plan can still have poor cash flow if spending arrives before revenue.
- This section is the best place to review liquidity risk.
27. Summary
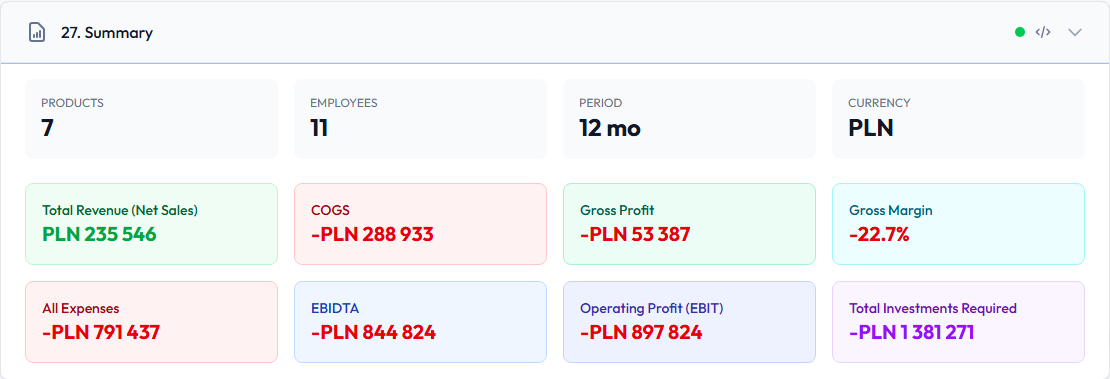
Summary gives a quick top-level view of the plan.
Outputs:
- Products: number of product/service rows.
- Employees: total planned employees.
- Period: planning horizon in months.
- Currency: plan currency.
- Total Revenue (Net Sales): revenue after discounts and returns.
- COGS: direct costs.
- Gross Profit: net sales minus COGS.
- Gross Margin: gross profit percentage.
- All Expenses: operating expense total.
- EBITDA/operating indicators: operating performance before or after selected cost categories.
- Operating Profit (EBIT): final operating profit.
- Total Investments Required: funding need.
Functionality:
- Summary pulls from the full calculation chain.
- It is the fastest way to check whether the plan is directionally healthy.
- If a summary value looks wrong, work backward through its source section: revenue, COGS, expenses, investments, or plan settings.
JSON and Calculation Viewer
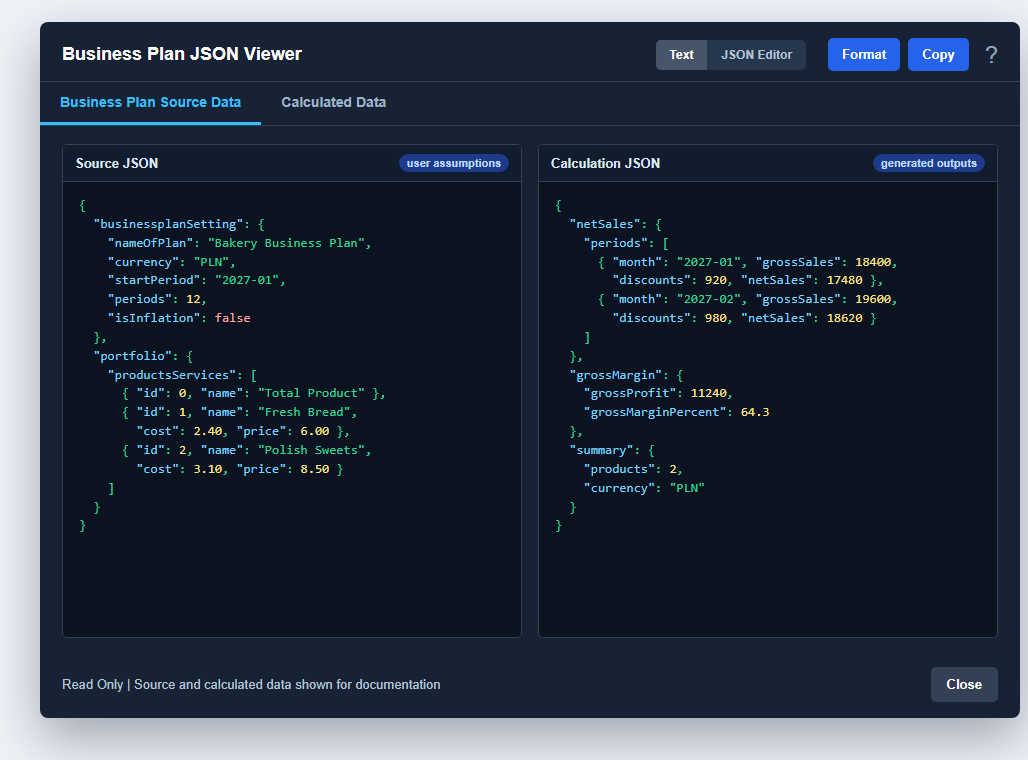
Each section has a JSON action. The modal has two tabs:
- Business Plan: the source JSON for the selected section.
- Calculation: the calculated data associated with that section.
This is useful when a pivot, table, or chart needs to be traced back to its source assumptions.
Persistence
The editor saves:
- source plan data to
businessplanSourceData - optional sanitized calculation state to
businessplanPrecalculatedData - browser drafts to local storage while editing
Some derived sections are intentionally rebuilt from source assumptions instead of being treated as user-entered data.