
Table of Contents
Business Plan Analytics
Business Plan Analytics is the report view for a calculated business plan. It turns the saved calculator data into a readable management report with KPIs, charts, monthly tables, yearly summaries, and export options.
Open it from a business plan detail page with View Analytics, or directly at /view-analytics/:businessPlanId.
Report Header, Plan Information, and Time Window
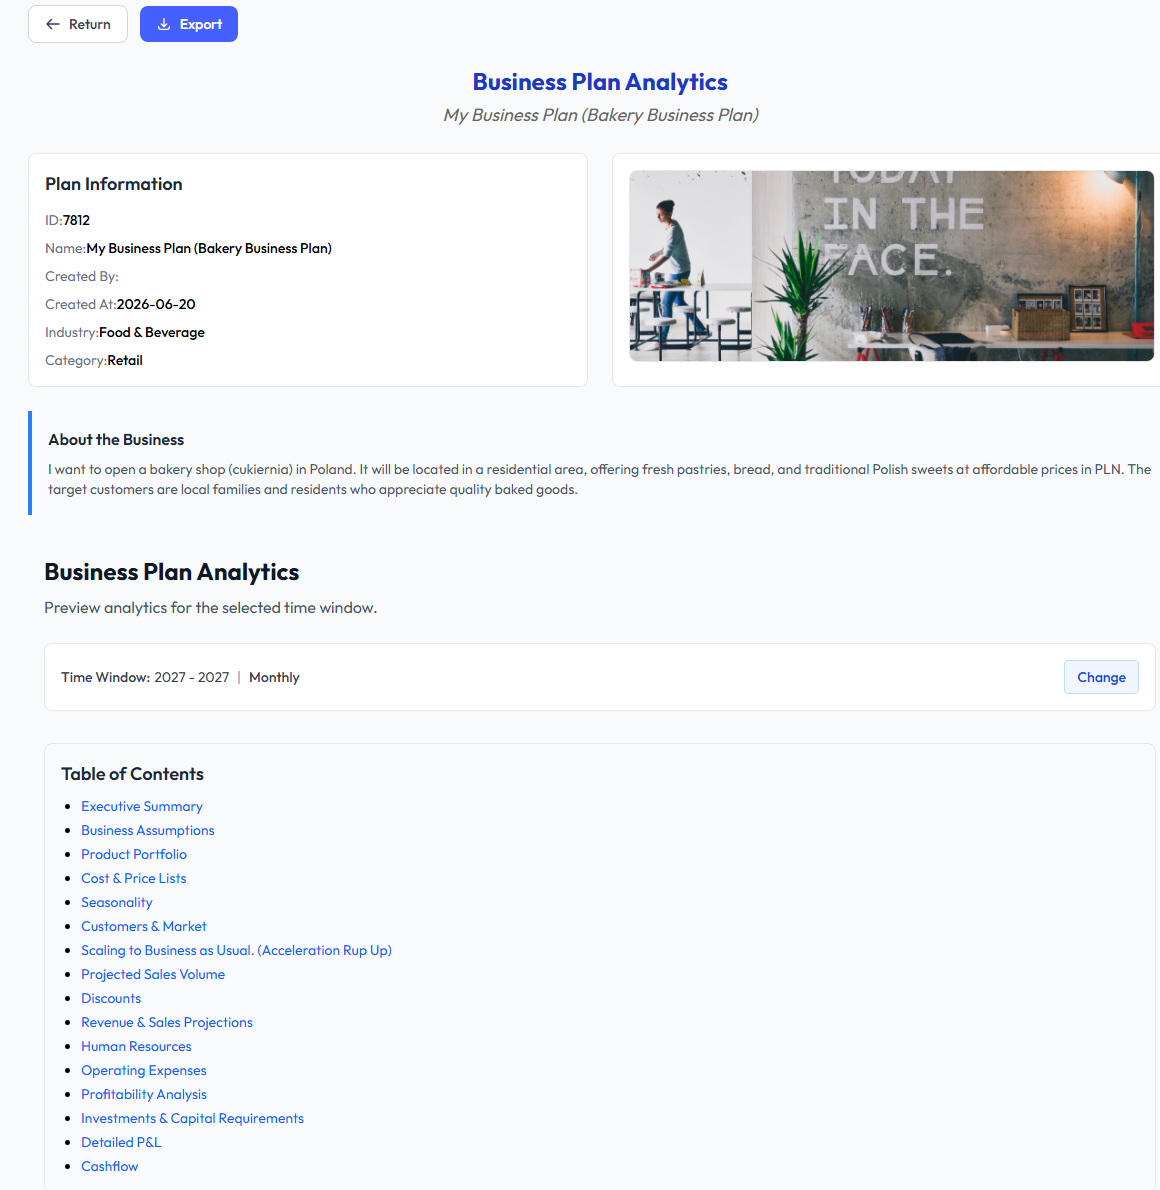
The top of the report identifies the plan and controls the report view.
- Return to Details: goes back to the business plan detail page.
- Export: opens report export options for HTML, DOCX, PDF, or print.
- Plan information: shows the plan ID, name, creator, creation date, industry, category, and description.
- Plan image: gives exported reports a recognizable visual reference.
- Time Window: switches the report between monthly and yearly views where supported.
- Table of Contents: lists the report sections so readers can scan the structure before reviewing details.
1. Executive Summary
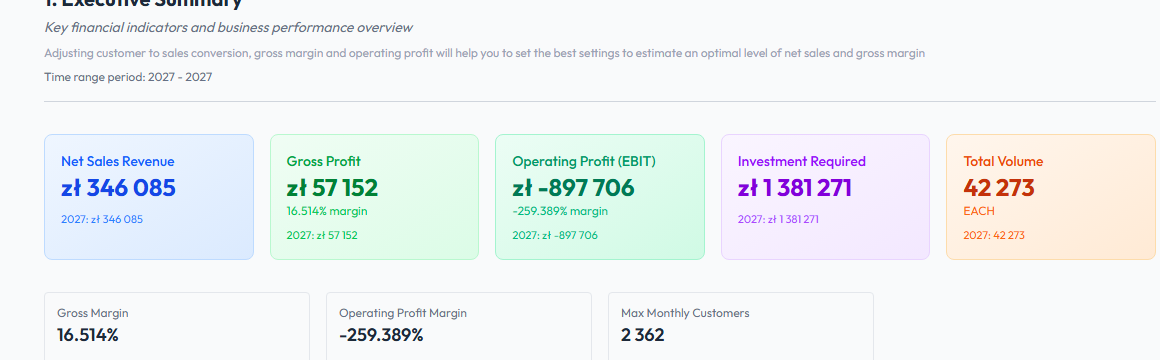
The Executive Summary is the quick health check for the plan. It demonstrates the headline financial outcome before the reader opens detailed tables.
- Net Sales Revenue: total revenue after discounts and returns.
- Gross Profit: sales revenue after product or service cost of goods sold.
- Operating Profit (EBIT): profit after operating expenses, payroll, and other modeled costs.
- Investment Required: the highest funding need implied by the plan’s cash flow and investment schedule.
- Total Volume: total sold units or service volume across the report period.
- Gross Margin and Operating Profit Margin: profitability quality indicators, useful for comparing plans with different revenue sizes.
- Max Monthly Customers: the peak customer load the business must be able to serve.
2. Business Assumptions
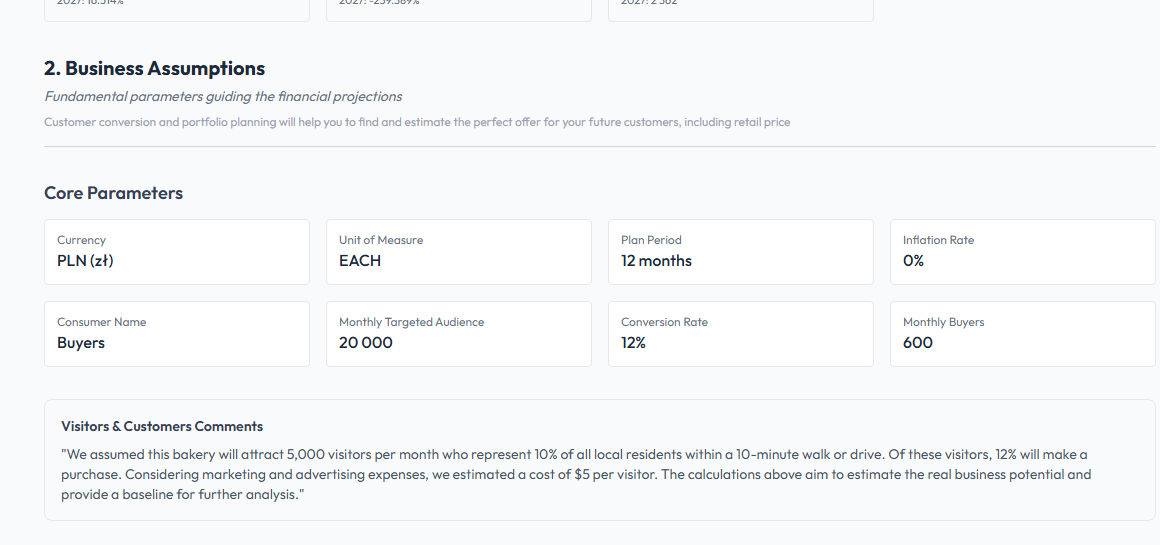
Business Assumptions records the core inputs behind the report. This section demonstrates what baseline context the calculations are using.
- Currency and Unit of Measure: define how money and volume are presented.
- Planning Period: confirms the first month, last month, and length of the projection.
- Inflation: shows whether general inflation assumptions are present.
- Consumer, Product Category, and Audience: describe the target market context.
- Conversion Rate, Buyers, and Customer Inputs: connect market assumptions to modeled demand.
- Comments: preserve plan-level notes that explain the reasoning behind the model.
3. Product Portfolio
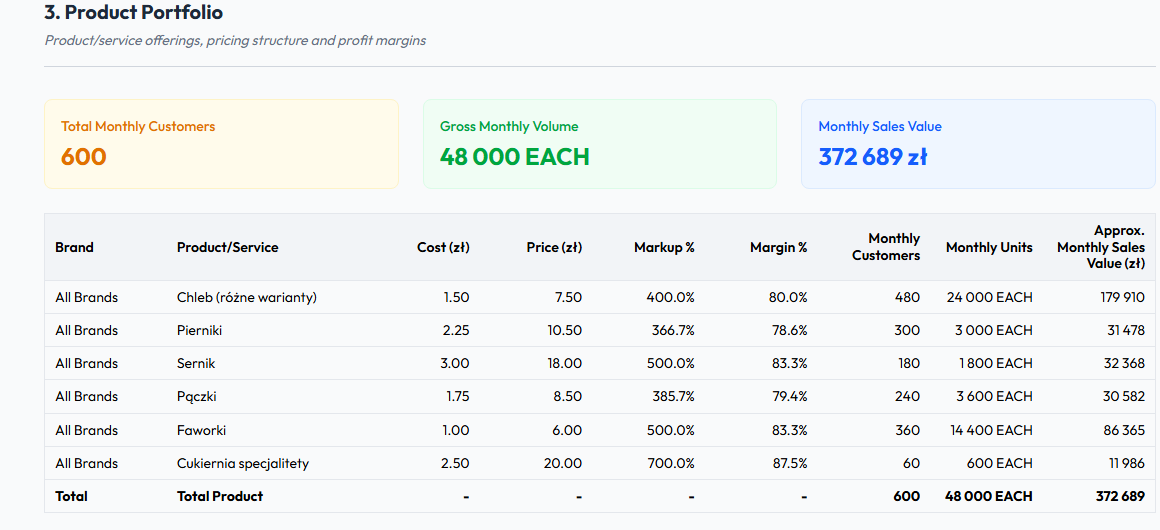
Product Portfolio demonstrates what the business sells and how each offer contributes to revenue.
- Summary cards: count products, brands, average price, and monthly sales value.
- Product table: compares cost, price, markup, margin, monthly customers, items per order, sales volume, and expected monthly value.
- Total row: aggregates portfolio economics so the reader can see the combined monthly sales engine.
- Markup and margin columns: help identify products that create value versus products that may need pricing or cost review.
4. Cost & Price Lists
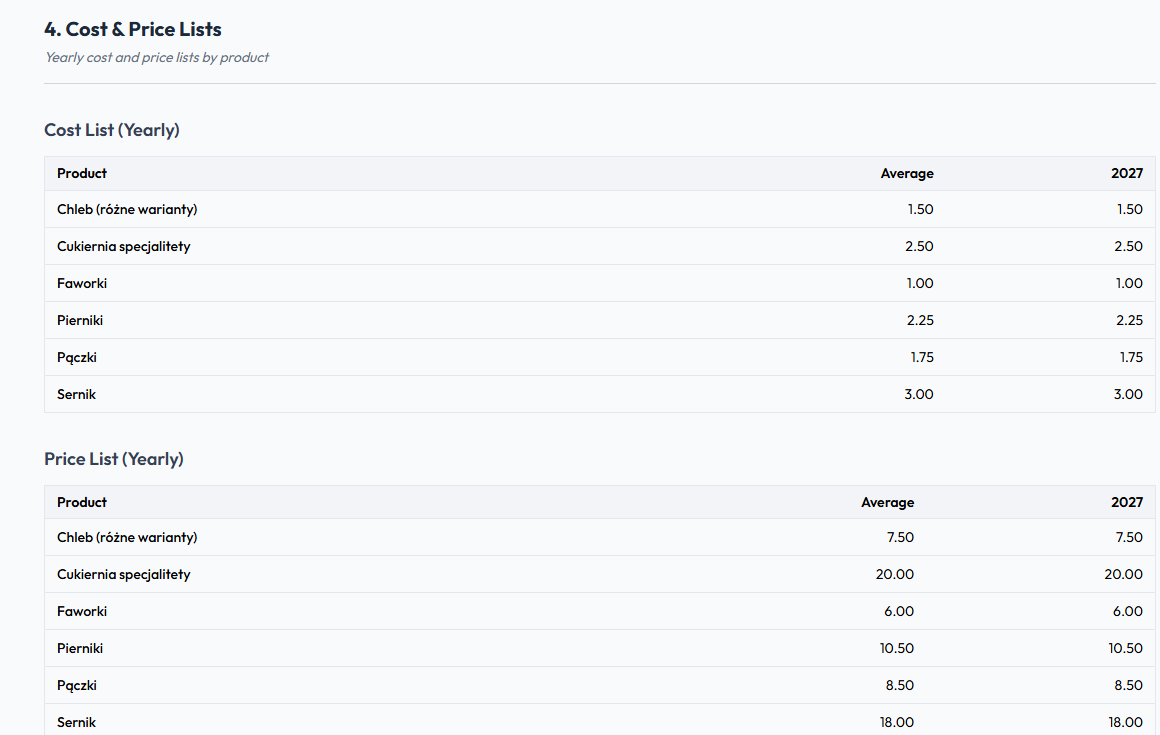
Cost & Price Lists demonstrate how product costs and prices evolve across the plan period.
- Cost List: shows projected unit cost by product and year.
- Price List: shows projected unit sales price by product and year.
- Average row: provides a quick check of overall portfolio cost and pricing movement.
- Use this section to confirm inflation, price increase, or manual override effects before reviewing revenue and margin charts.
5. Seasonality
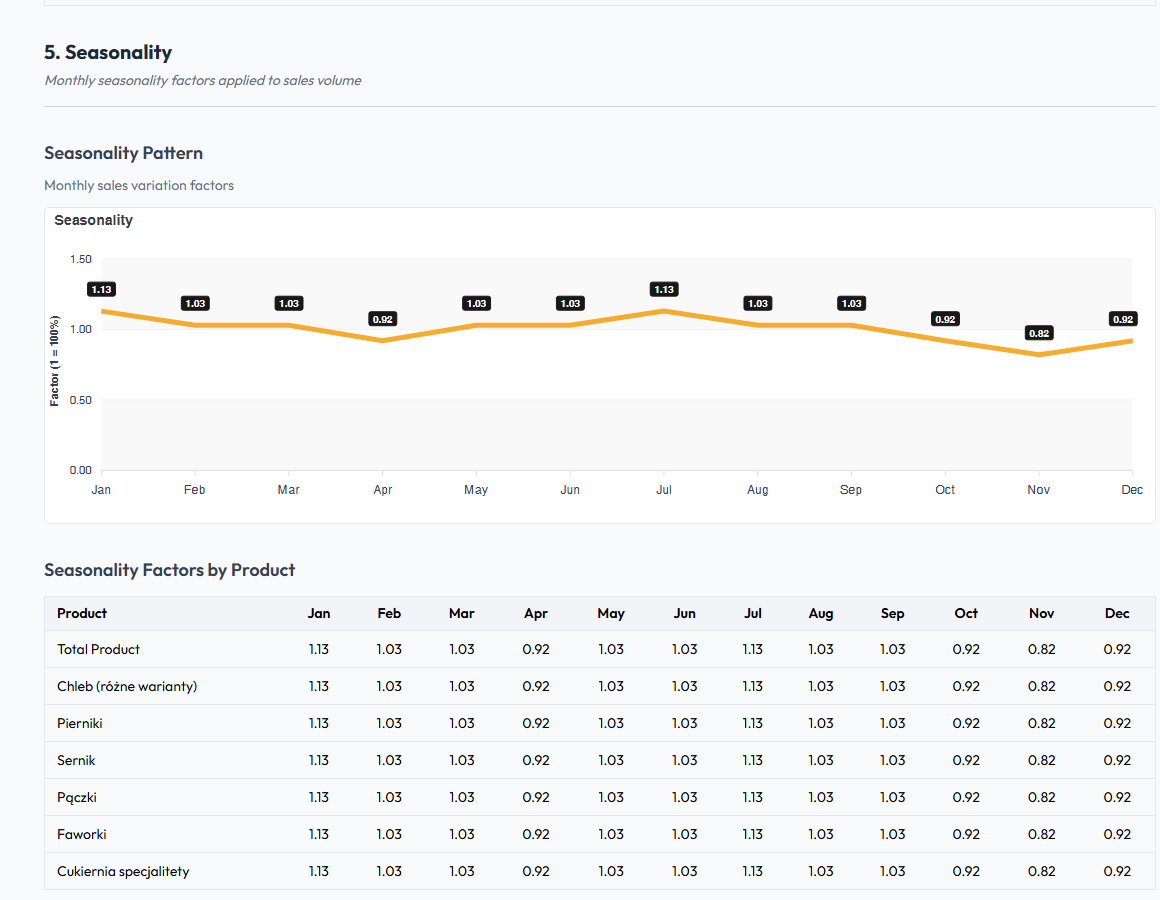
Seasonality demonstrates how monthly demand is adjusted before final sales volumes are calculated.
- Line chart: shows the monthly seasonality pattern. Values above
1.00increase demand for that month, while values below1.00reduce it. - Product rows: show the specific monthly factors applied to each product or service.
- Higher summer, winter, holiday, or campaign months become visible here before they appear as sales spikes in later sections.
6. Customers & Market
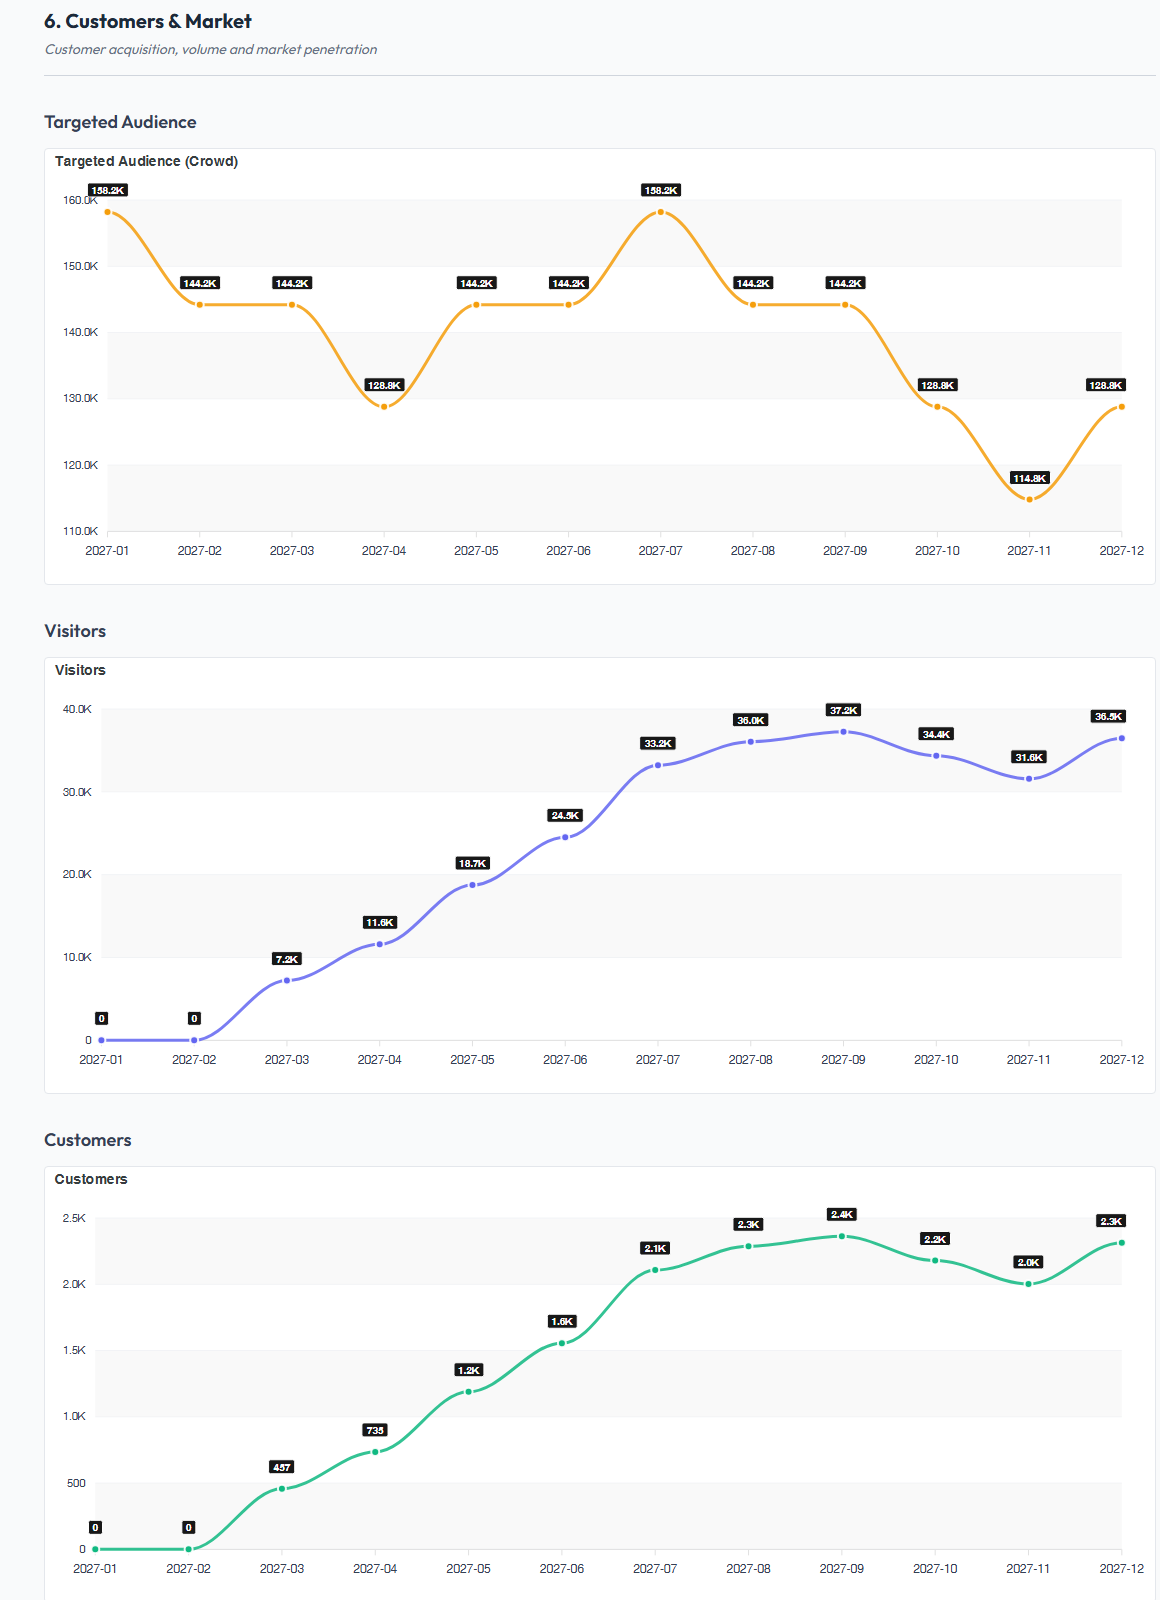
Customers & Market demonstrates how the addressable audience turns into visitors and customers over time.
- Targeted Audience / Crowd: shows the market or audience pool used by the plan.
- Visitors: shows expected traffic or reached users by month.
- Customers: shows the converted customer count after conversion and growth assumptions.
- This section helps verify whether customer growth looks realistic before sales value is reviewed.
7. Scaling to Business as Usual. (Acceleration Ramp Up)
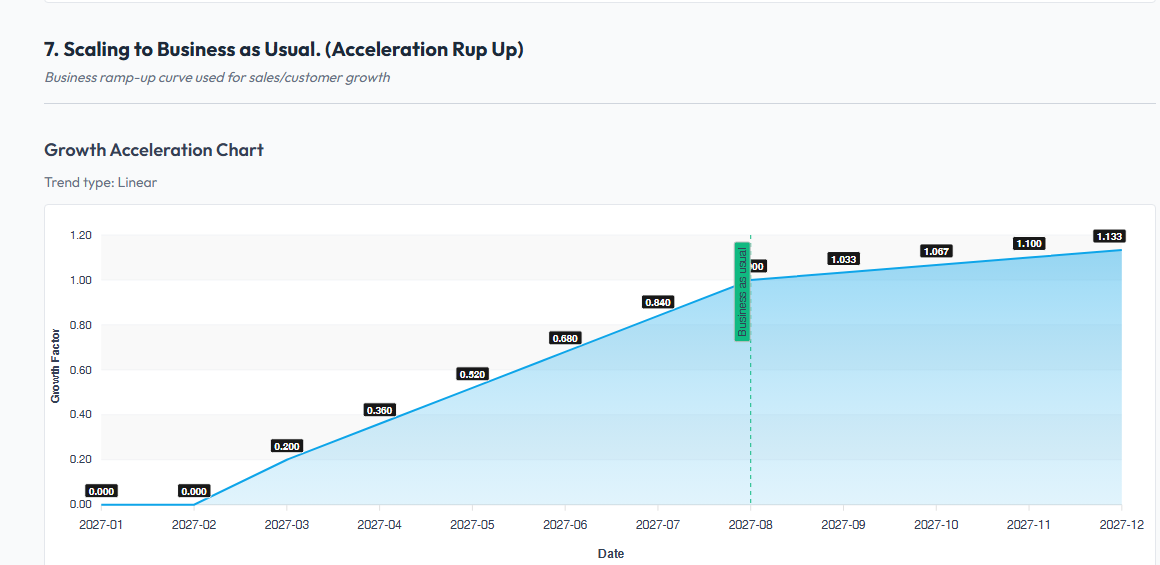
Scaling to Business as Usual demonstrates how quickly the plan reaches its normal operating level.
- Ramp-up chart: shows the acceleration factor applied during launch and growth months.
- Trend type and milestone notes: explain whether the business grows steadily, quickly, or with a delayed curve.
- Business-as-usual point: indicates when the model expects normal activity levels rather than launch-stage activity.
- Use this section to check whether early sales are being modeled too aggressively or too conservatively.
8. Projected Sales Volume
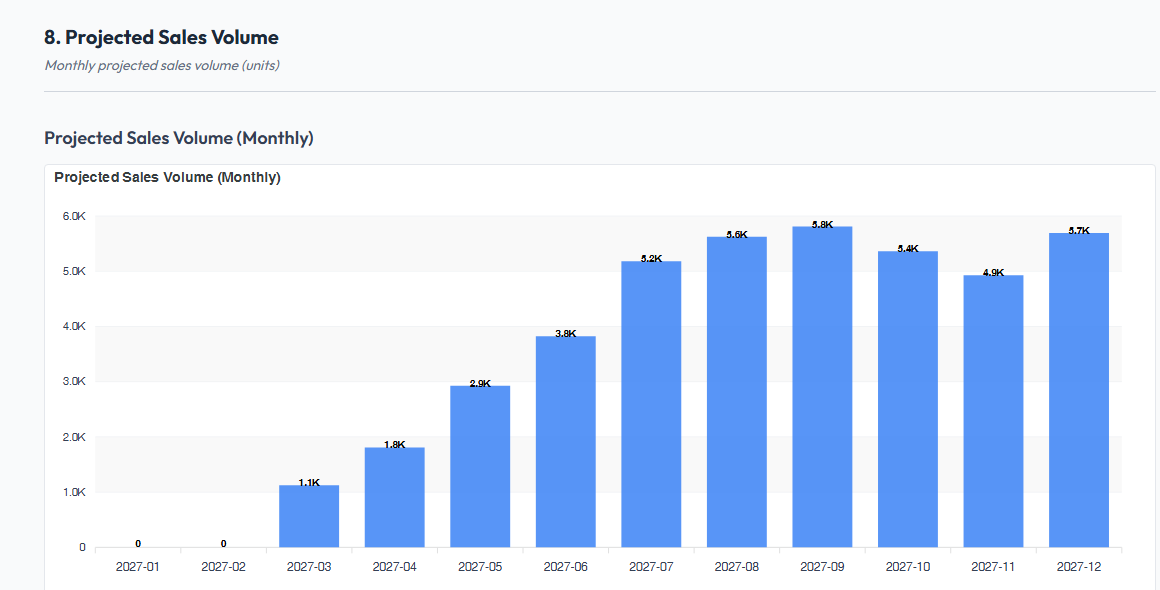
Projected Sales Volume demonstrates the monthly quantity of products or services expected to be sold.
- The chart turns customers, orders, items per order, seasonality, and ramp-up assumptions into monthly volume.
- Volume is one of the main drivers for sales revenue, product COGS, inventory needs, and operational capacity.
- Spikes or drops here should be checked against seasonality, acceleration, and product active periods.
9. Discounts
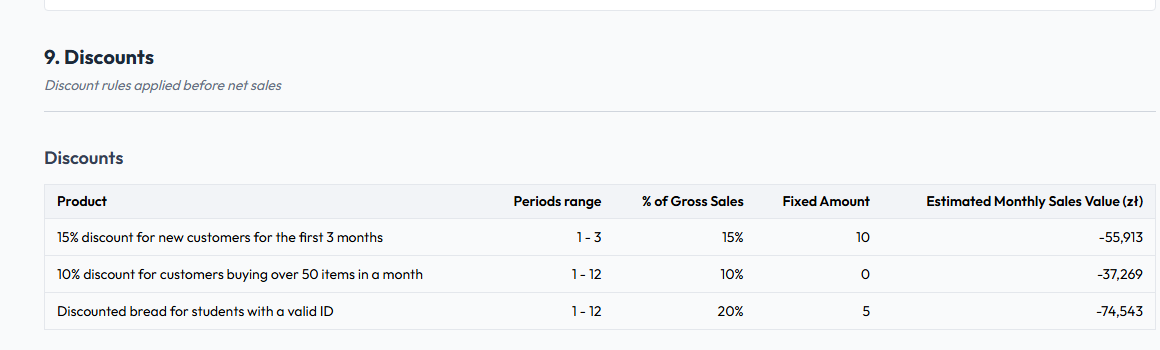
Discounts demonstrate how gross sales are reduced before net sales revenue is calculated.
- Discount name and description: identify the commercial rule.
- Product: shows whether the discount applies to a specific offer.
- Beginning Month and Ending Month: define the active period.
- Sales Discount: reduces sales by a percentage.
- Fixed Amount: subtracts a fixed value when configured.
- Estimated Monthly Sales: helps show the commercial scale affected by the discount.
10. Revenue & Sales Projections
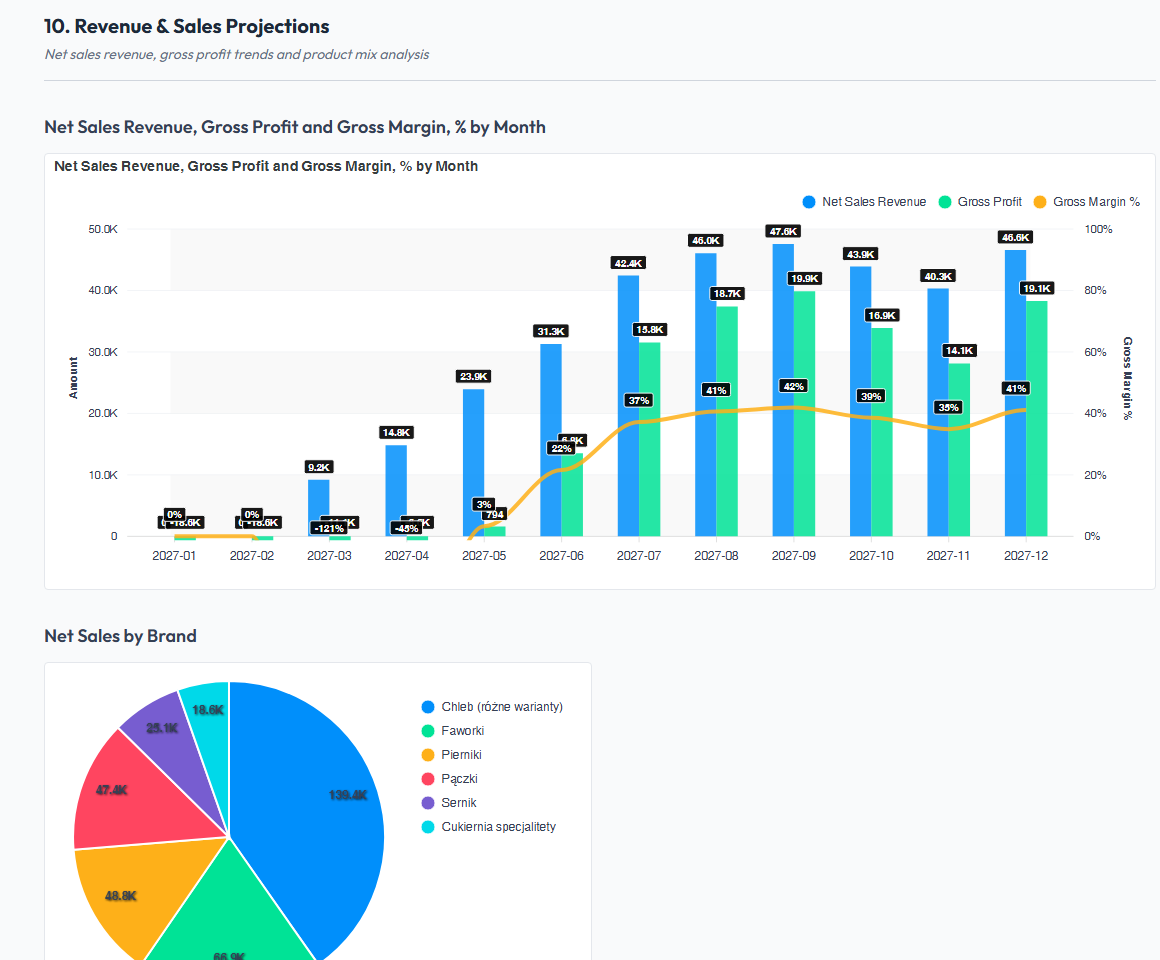
Revenue & Sales Projections demonstrates how volume becomes money.
- Net Sales Revenue, Gross Profit, and Gross Margin: show the relationship between sales, direct cost, and profitability quality.
- Brand and product split charts: show which parts of the portfolio drive revenue.
- Salesperson split: appears when salesperson assignments are modeled, helping show who or which team owns revenue.
- Sales acceleration chart: connects revenue changes to the growth curve used earlier in the report.
11. Human Resources
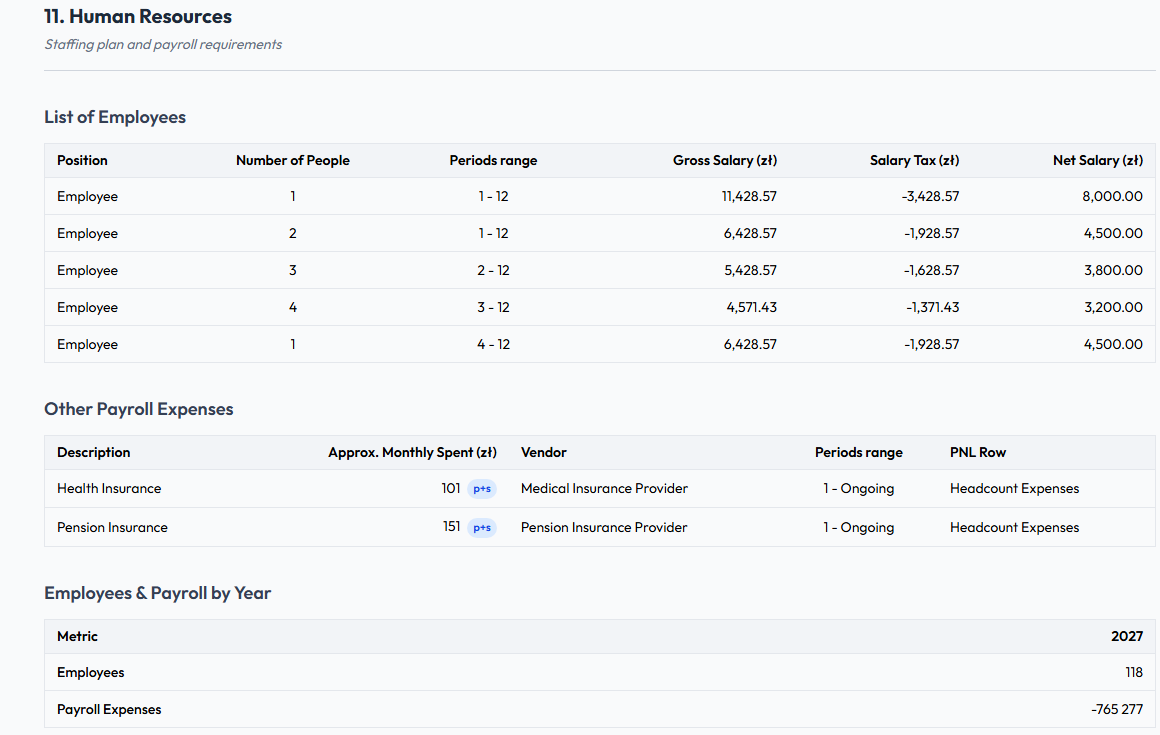
Human Resources demonstrates staff planning and payroll impact.
- Employees table: lists roles, planned headcount, monthly salary, active period, salary increase, and payment timing.
- Monthly payroll table: shows payroll cost by role and month.
- Employees by year: demonstrates headcount growth.
- Payroll by year: shows the annual payroll burden created by the hiring plan.
- This section helps check whether staffing is aligned with customer, sales, and operational growth.
12. Other COGS
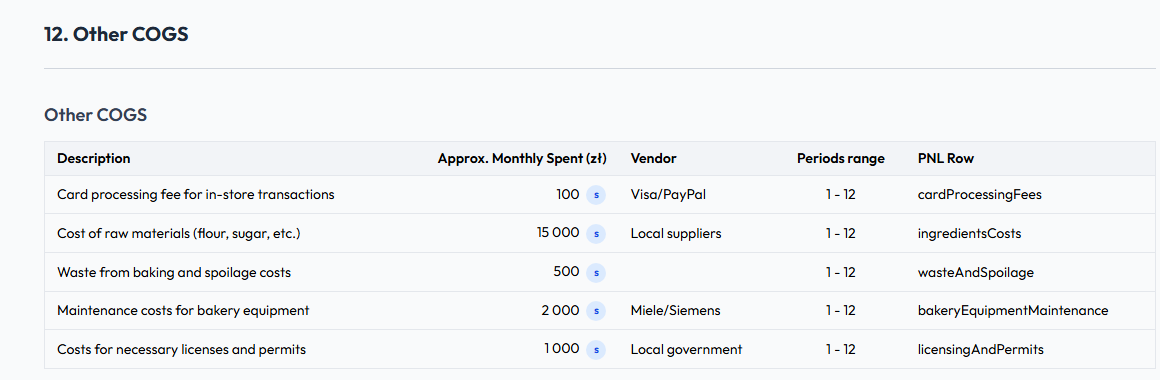
Other COGS demonstrates direct costs that are not captured in the product cost table.
- Name and vendor: identify the direct cost item and supplier.
- Monthly cost: shows the recurring direct expense.
- Beginning Month and Ending Month: define when the cost is active.
- P&L row: maps the cost to the financial statement structure.
- Use this section for hosting, packaging, commissions, transaction fees, materials, or other direct costs linked to delivery.
13. Operating Expenses
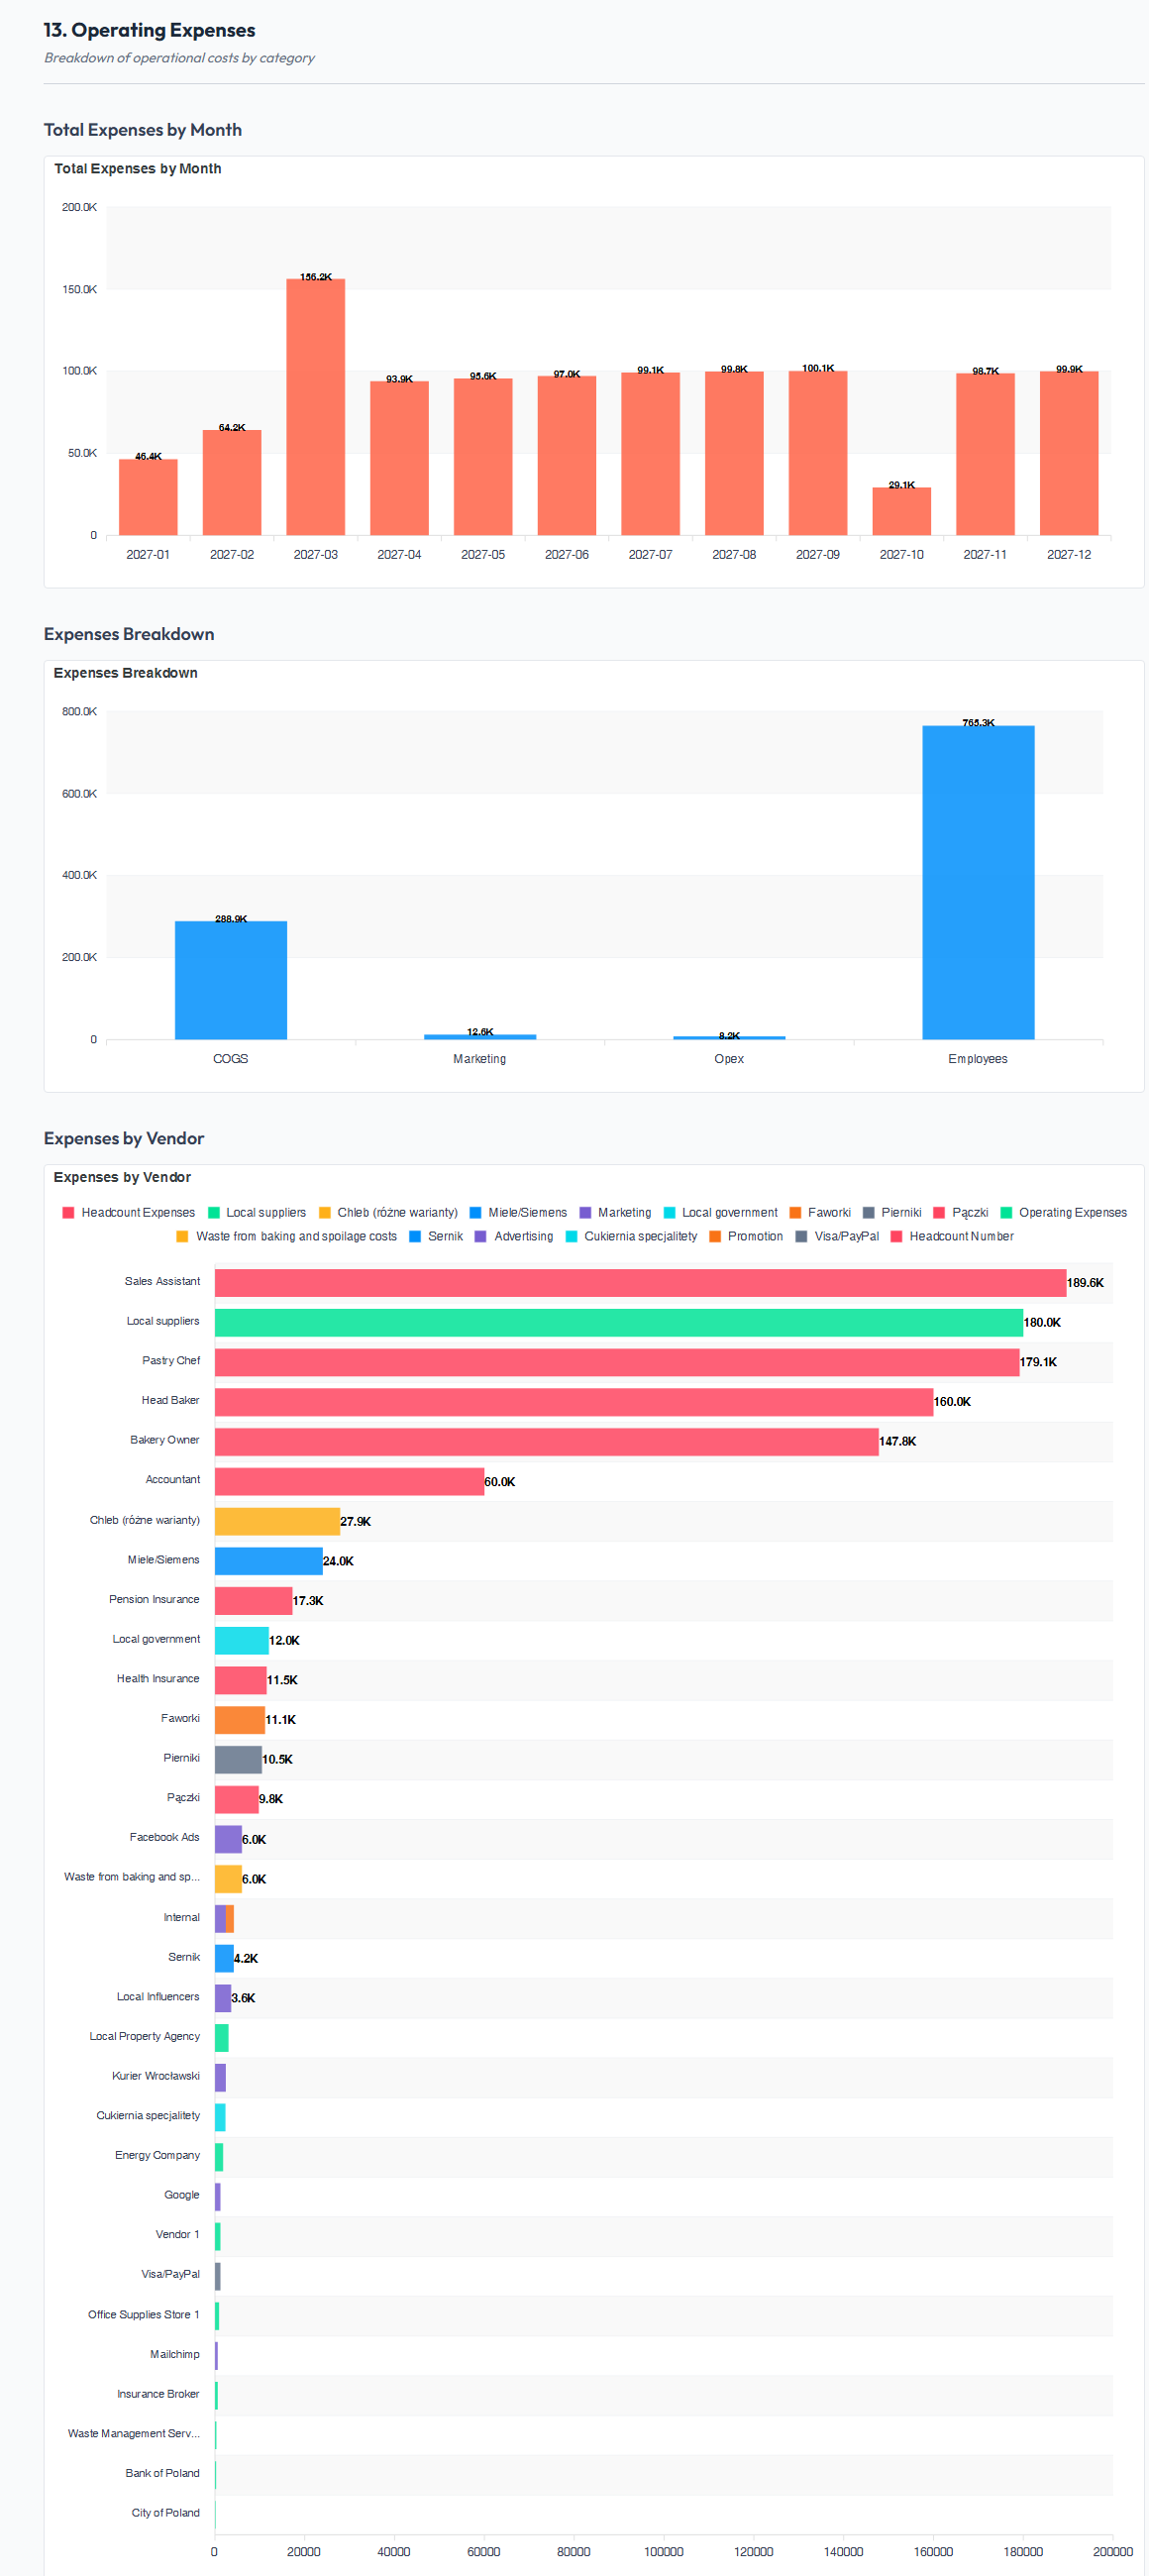
Operating Expense charts demonstrate how non-COGS spending behaves over time.
- Total Expenses by Month: shows the overall OPEX burden and highlights months with unusually high spend.
- Expense Category Breakdown: shows how expenses are distributed by type.
- Expenses by Vendor: helps identify supplier concentration and major recurring vendors.
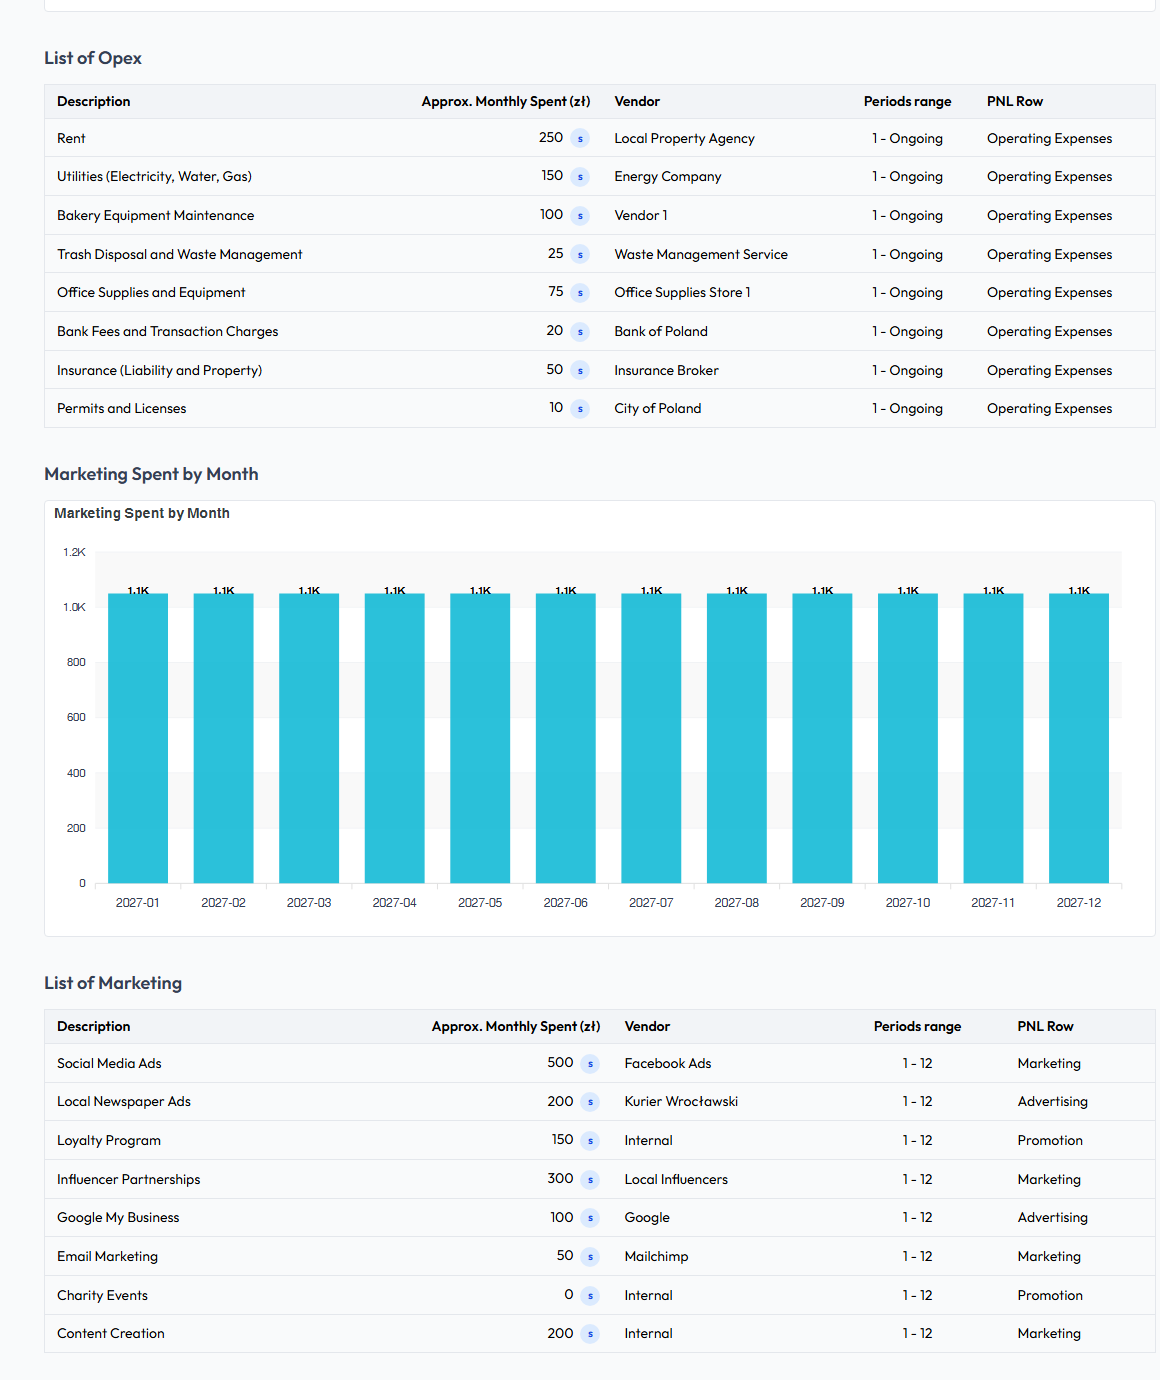
The tables under Operating Expenses explain the source rows behind the charts.
- OPEX list: shows recurring operating costs, vendors, active periods, and P&L mapping.
- Research and Development Expenditures: records product, technology, or development spending outside ordinary monthly OPEX.
- Marketing Spend and Marketing List: show planned campaign costs and active periods.
- Other Operating Income: records non-sales income that affects operating profit.
14. Profitability Analysis
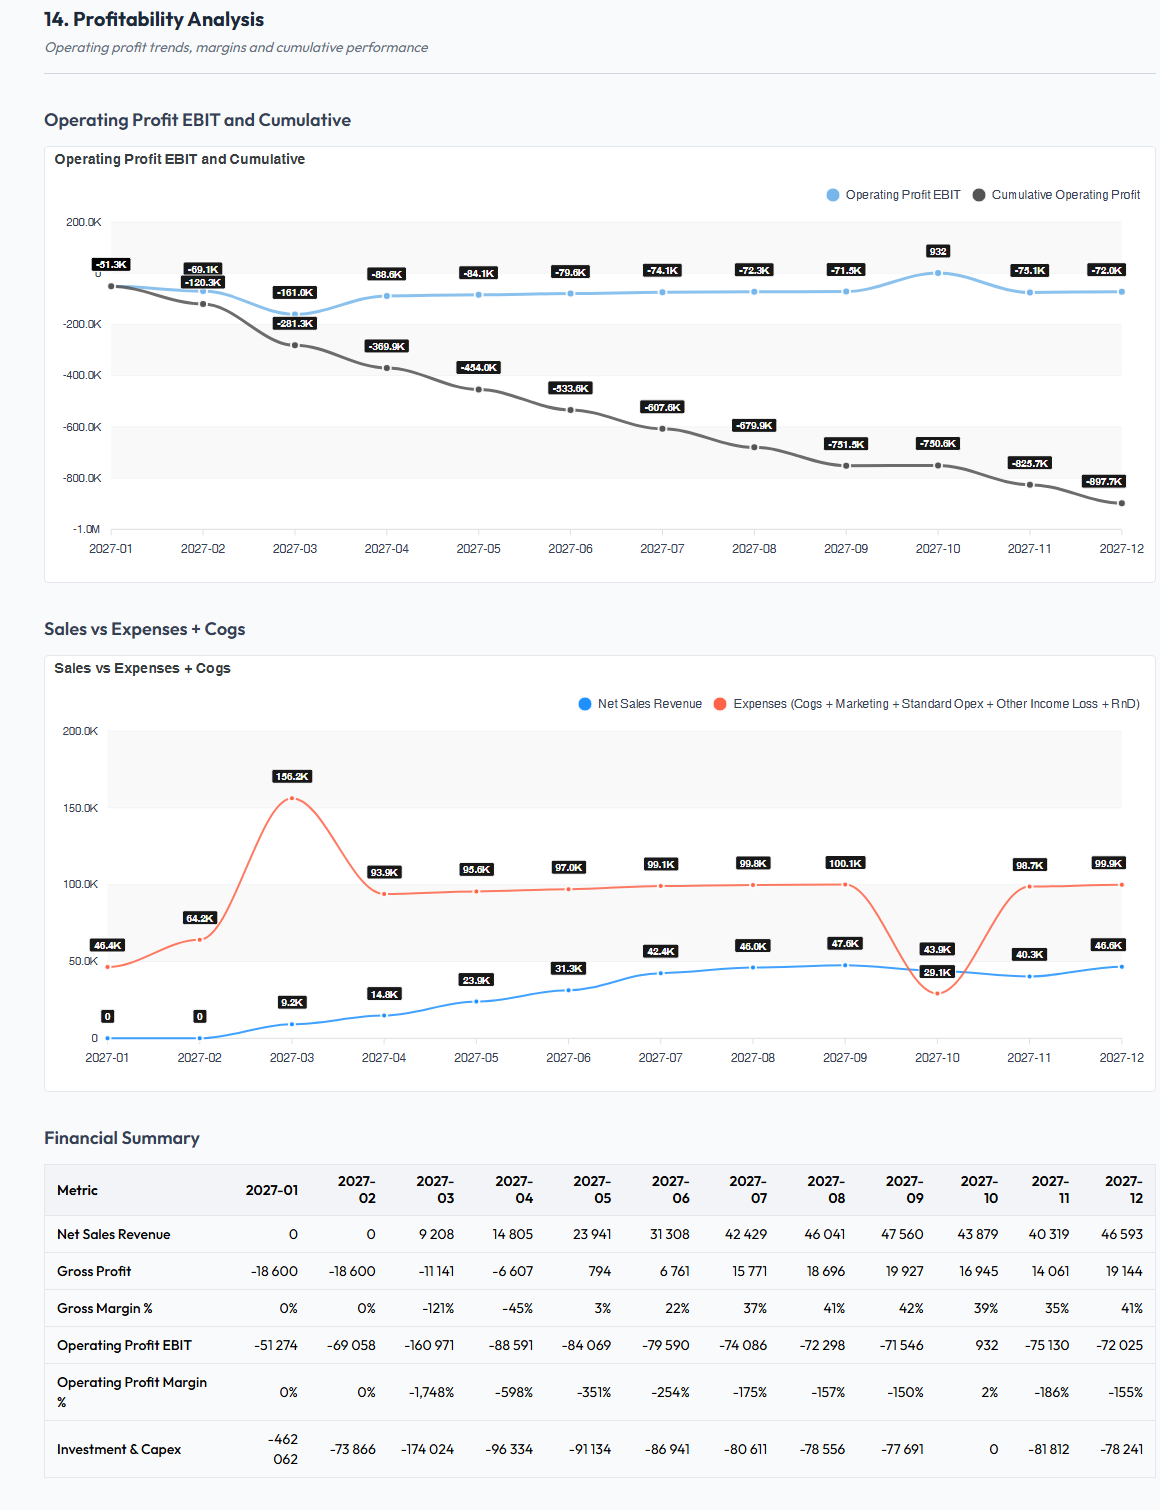
Profitability Analysis demonstrates whether the plan becomes financially sustainable.
- EBIT and Cumulative Operating Profit: show monthly operating profit and the accumulated result over time.
- Sales vs Expenses + COGS: compares revenue against the full operating cost base.
- Financial summary table: summarizes revenue, COGS, expenses, and operating profit by year or period.
- This section is useful for identifying break-even timing, loss-heavy launch months, and long-term operating margin.
15. Investments & Capital Requirements
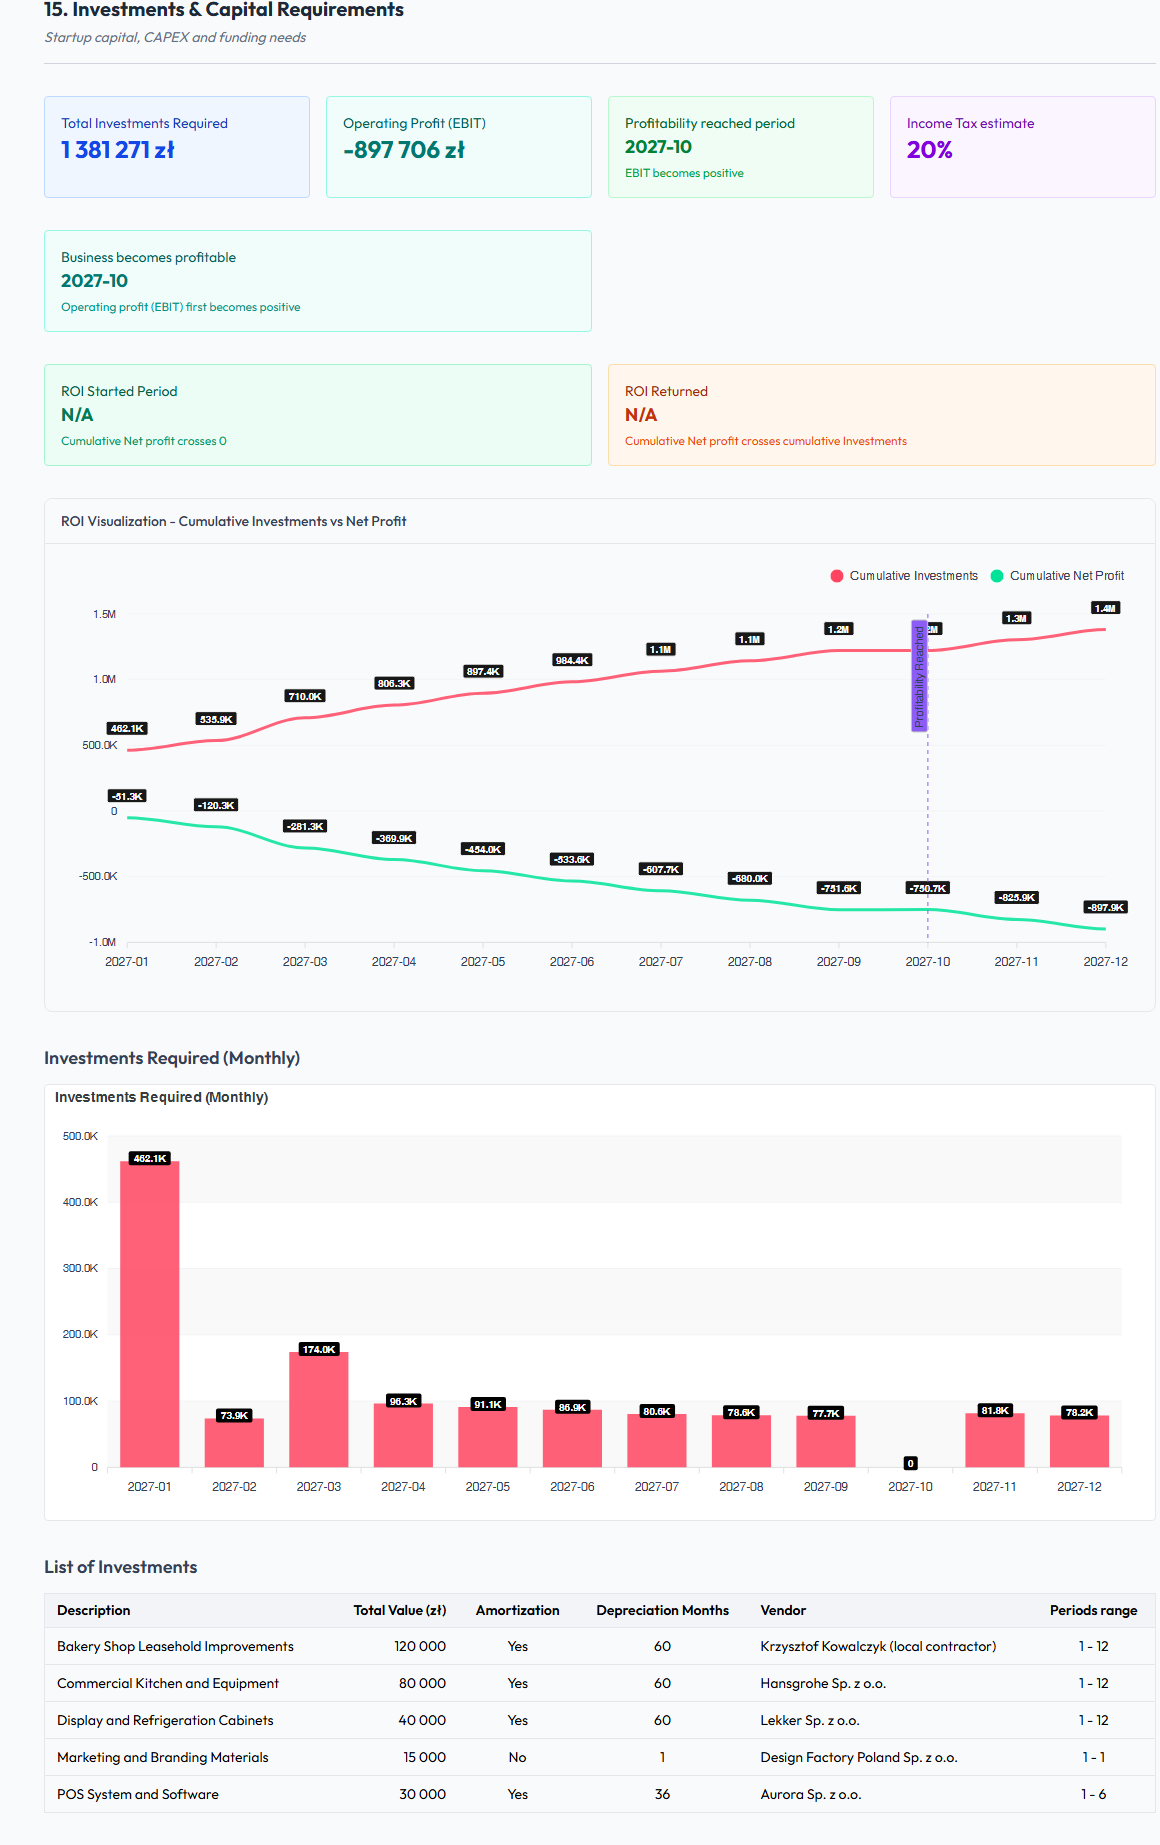
Investments & Capital Requirements demonstrates how much funding the plan needs and how investment returns behave.
- Total Investments Required: shows the funding need implied by the model.
- EBIT and Profitability Reached: indicate operating performance and when profitability begins.
- Income Tax: shows tax impact where modeled.
- ROI Started and ROI Returned: indicate when return tracking begins and when the investment is expected to be recovered.
- ROI chart: shows investment return progression.
- Investments Required chart: shows funding needs by month.
- Investments list: shows individual investment items, timing, values, amortization, and mapped P&L rows.
16. Detailed P&L
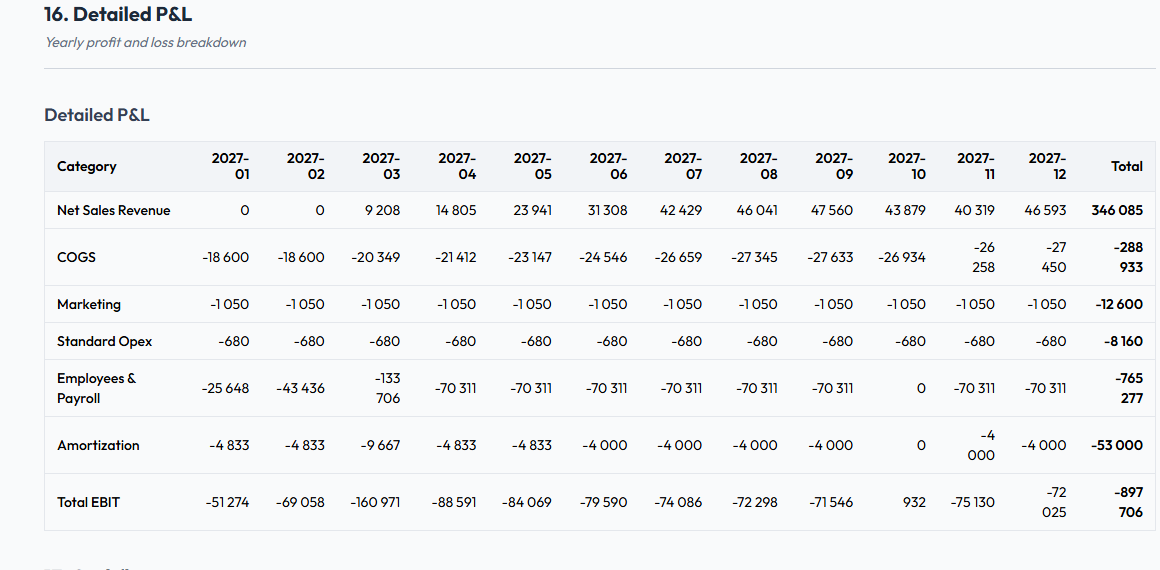
Detailed P&L demonstrates how the final operating result is built line by line.
- Net Sales Revenue: revenue after discounts and returns.
- COGS lines: include product/service COGS and other modeled direct costs.
- Marketing, OPEX, Payroll, and Amortization: show operating cost categories.
- Total EBIT: the final operating profit line before financing and non-operating effects.
- Use this table when a chart looks unexpected and the exact financial row needs to be traced.
17. Cashflow
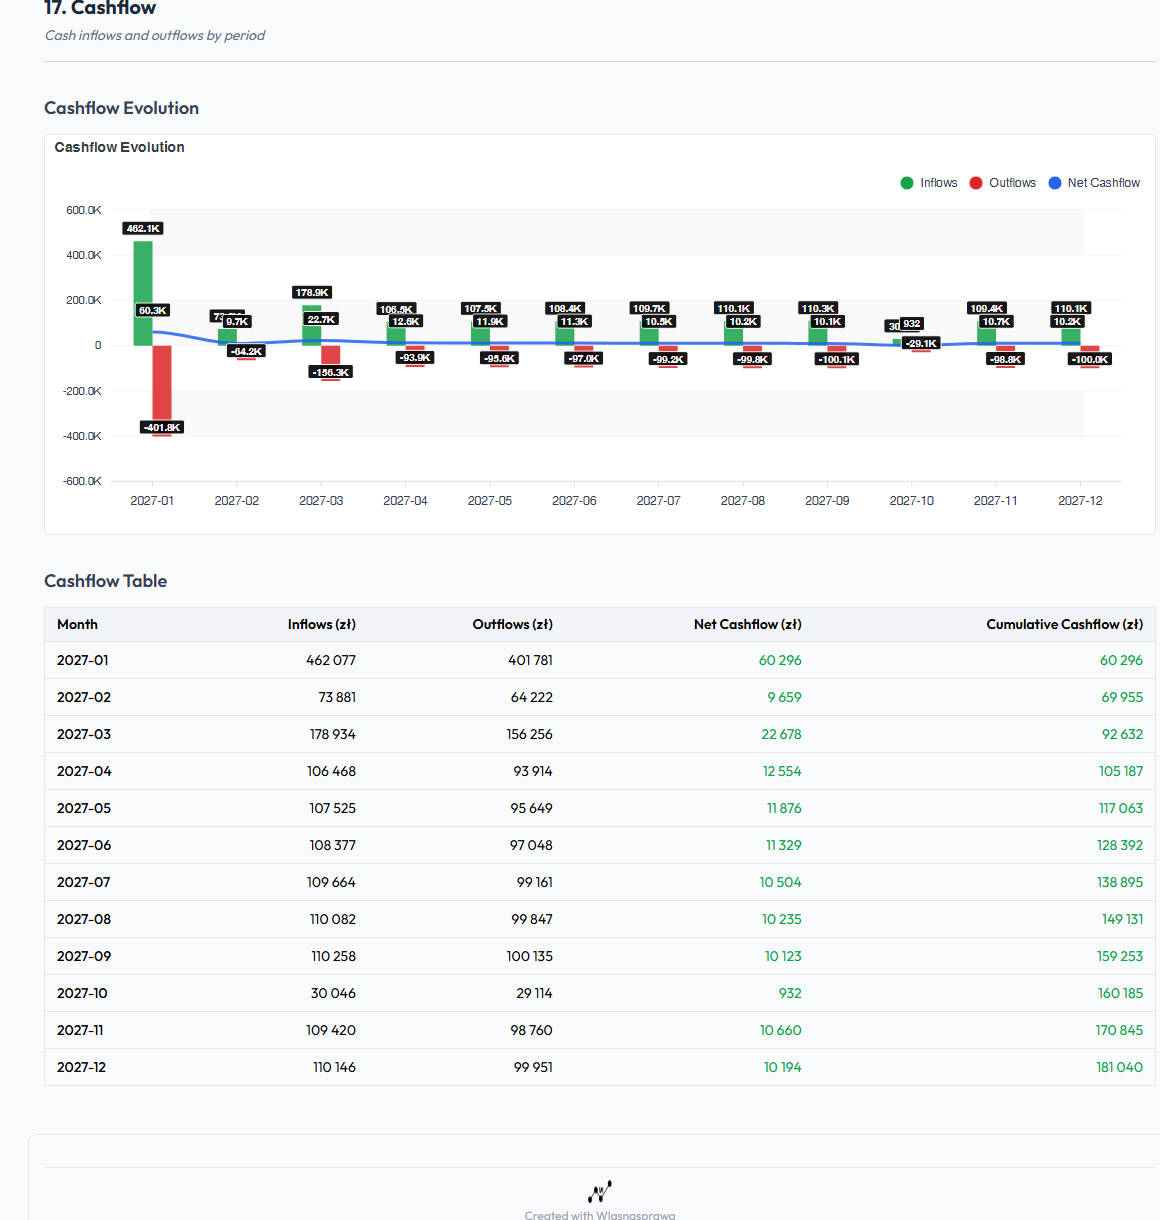
Cashflow demonstrates whether the business has enough cash to survive the modeled plan.
- Cashflow chart: compares inflows, outflows, and net cash movement.
- Cashflow table: shows period-by-period cash values, including cumulative impact.
- Negative periods indicate funding needs, timing pressure, or investment gaps.
- This section is often the best place to confirm whether a profitable plan still needs external capital because of timing.
Version Requirement
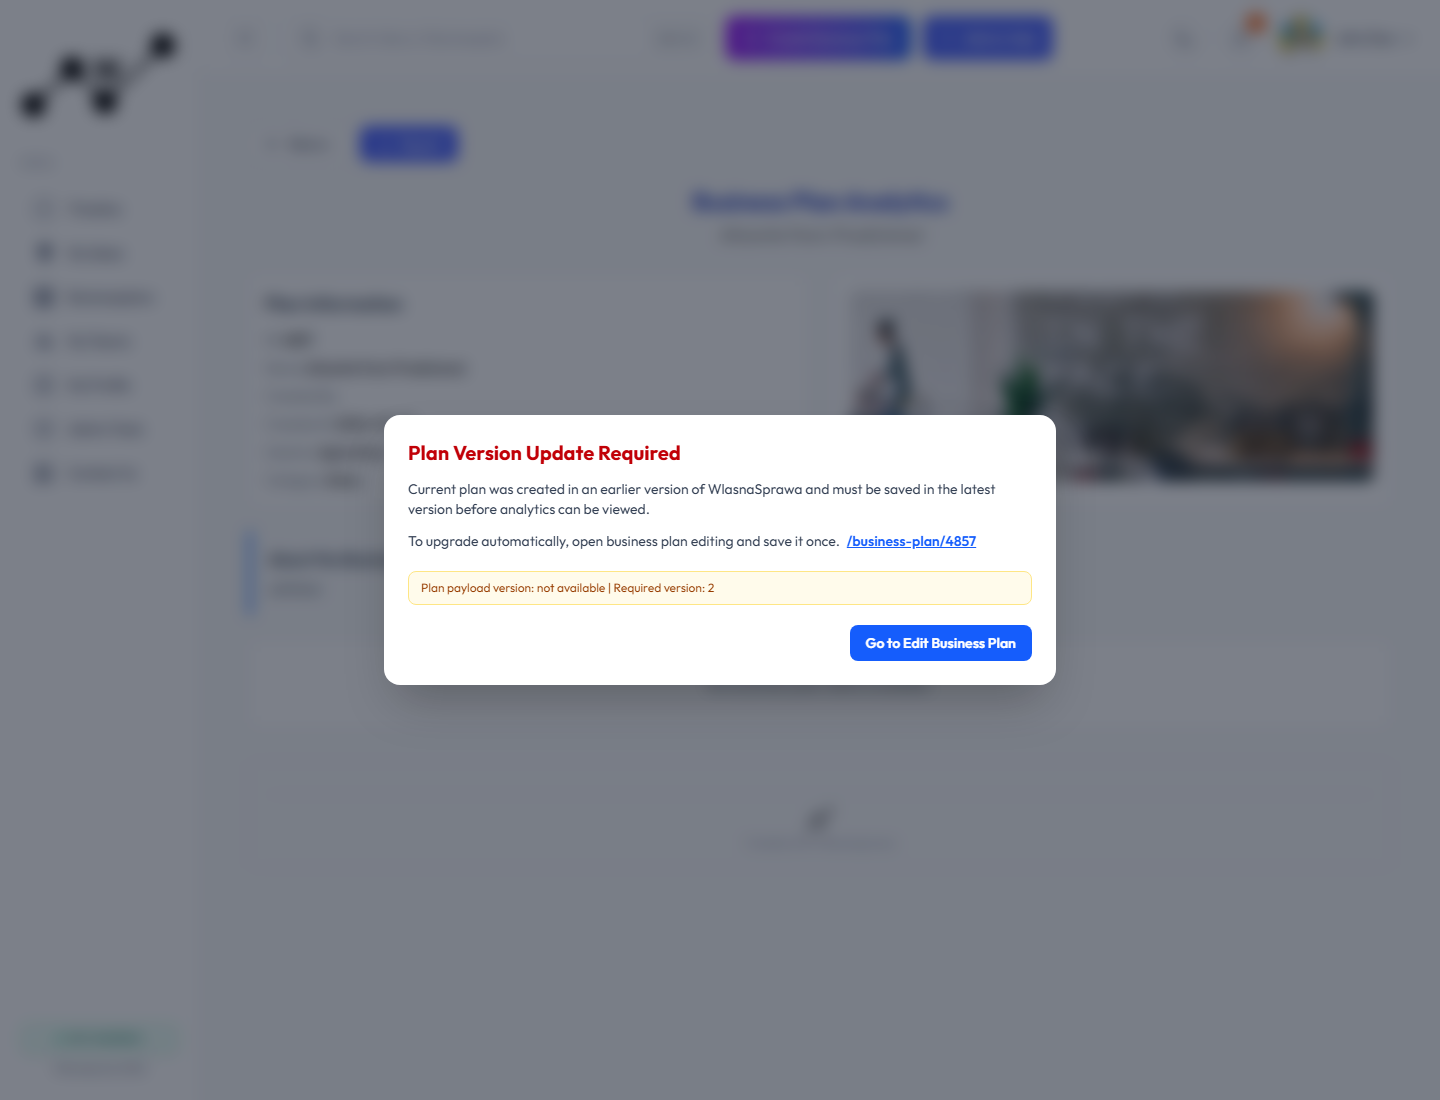
Analytics requires a current business plan payload. If an older plan is opened, the page shows a version warning instead of charts.
For example, the Alicante plan captured during documentation showed a message explaining that the plan needs to be opened in the editor and saved once so it can be upgraded to the latest payload version.
Recommended Workflow
- Open a business plan detail page.
- If the plan is old, click Edit and save it once to upgrade the payload.
- Return to the detail page.
- Click View Analytics.
- Review KPIs, charts, tables, and cashflow sections.
- Use Export when a shareable report is needed.
Relationship to Flat Data Downloads
Analytics is a visual report. Flat data download is a data export flow available from business plan actions and download modals. Use Analytics for human review and presentation; use flat data for spreadsheets, BI tools, or deeper external analysis.
Exporting Analytics Reports
Use Export when the analytics report needs to be shared, archived, printed, or attached to external business materials.
The export modal opens a preview of the same report content shown on the Analytics page. Review the preview first to confirm that charts, tables, plan information, and the selected time window look correct before generating a file.
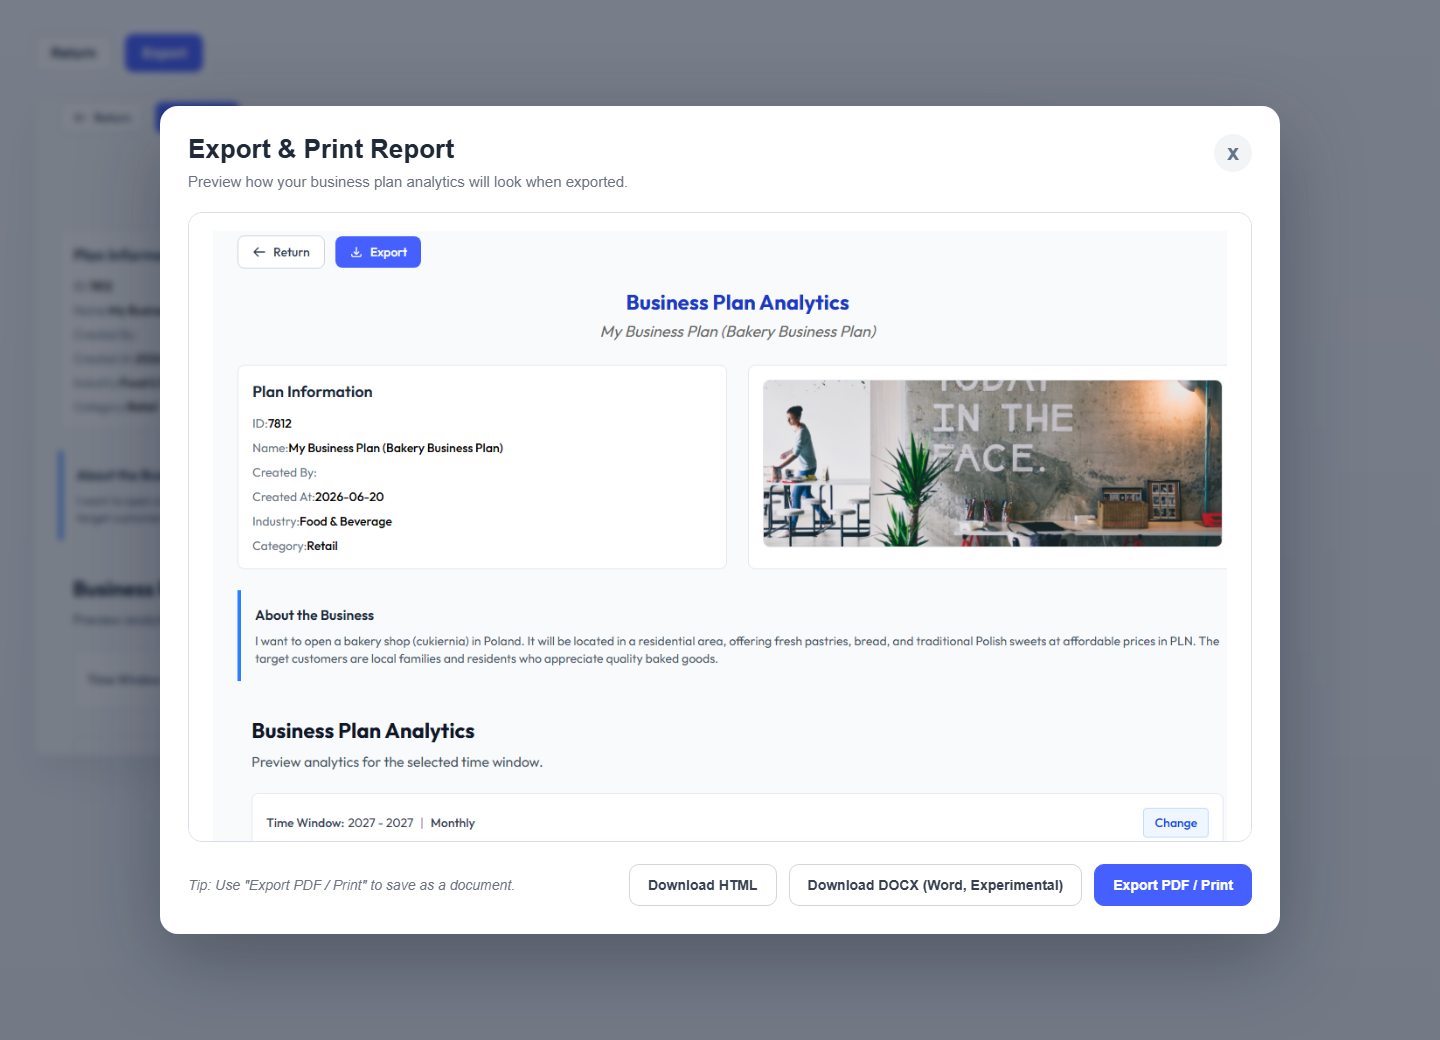
Available export actions:
- Download HTML: saves the report as a standalone
.htmlfile. This is useful when the report should stay close to the web version and be opened later in a browser. - Download DOCX: creates a Word-compatible document. This option is marked experimental, so review formatting after download, especially around wide tables and charts.
- Export PDF / Print: opens the browser print flow in a new print-ready report window. From the operating system print dialog, choose a physical printer or select a PDF destination such as Save as PDF / Microsoft Print to PDF.
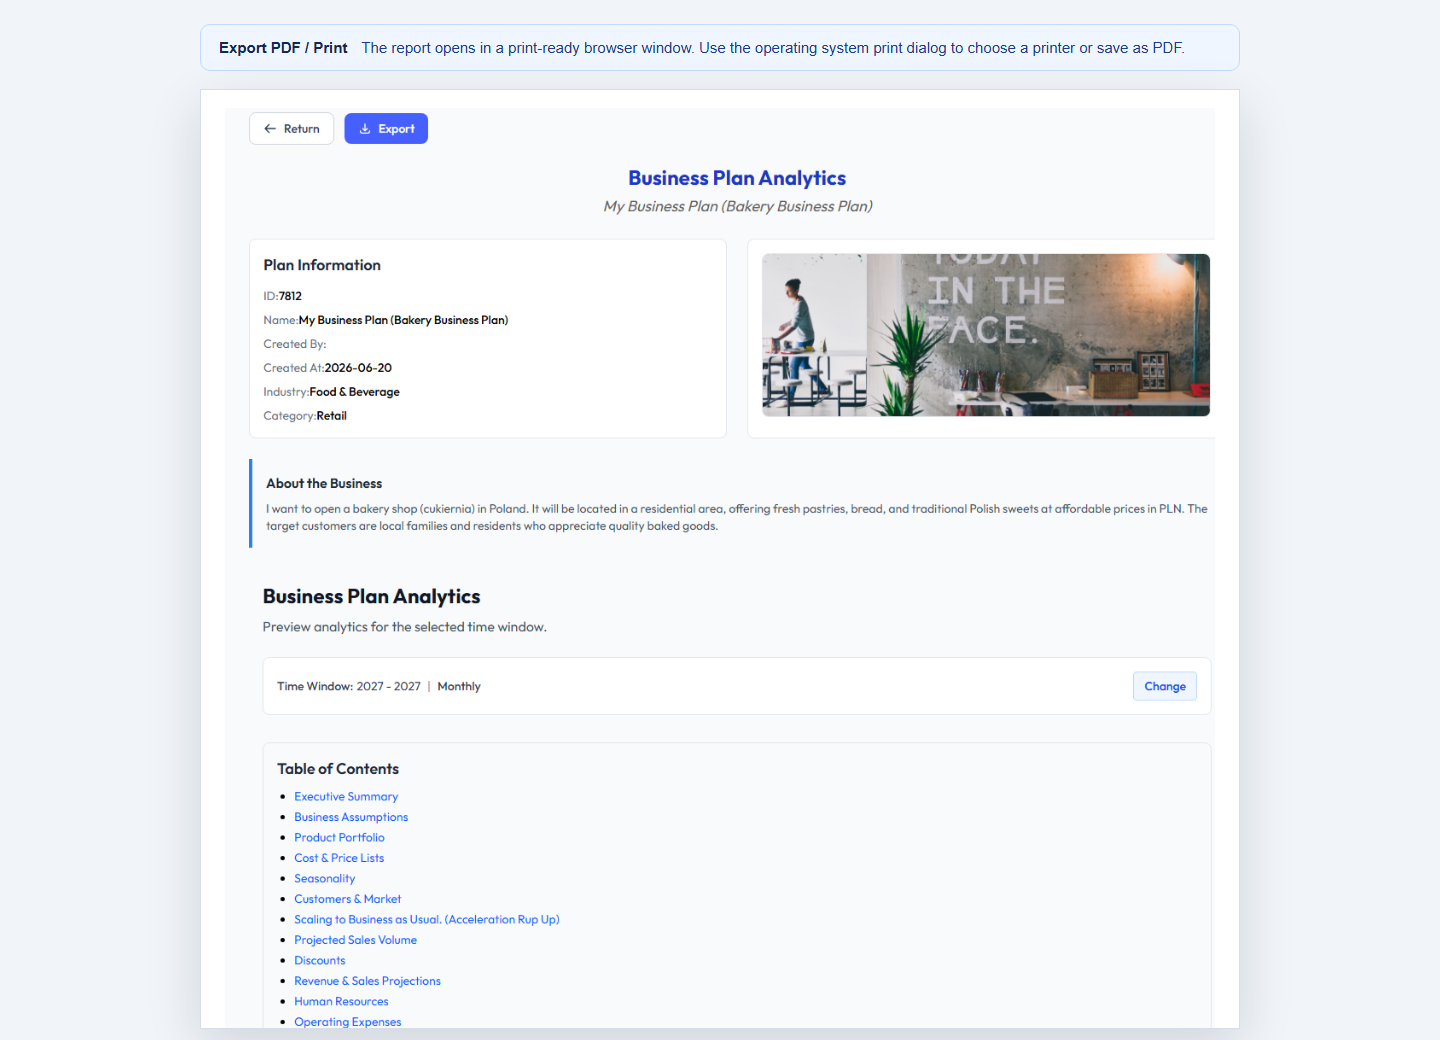
The PDF and print option depends on the browser and operating system print dialog. If a PDF file is needed, choose the PDF printer/destination there, set page size and orientation if necessary, then save the file from the dialog.